
Today’s Weekly Initial Unemployment Insurance Claims for the prior week (May 2 ) show that the unemployment picture is continuing to weaken. Today’s report shows 294,000 Americans applying for unemployment benefits marking the third jump in a row for the Weekly Initial Unemployment Insurance Claims.
This marks the highest level in 14 months.
Even the average of new claims which is less volatile, still shows a rise to 268,250.
While these numbers are still quite good and represent one of the best periods in US history for job growt, any move above 300,000 for the Weekly Initial Unemployment Insurance Claims in coming weeks, will signal further volatility within stocks according to this market timing system.
Market Timing System Says Stay Invested
According to the market timing system using the Weekly Initial Unemployment Insurance Claims, investors should still stay invested in equities as the chance of a large plunge into a bear market is extremely slim.
Market Timing System Chart
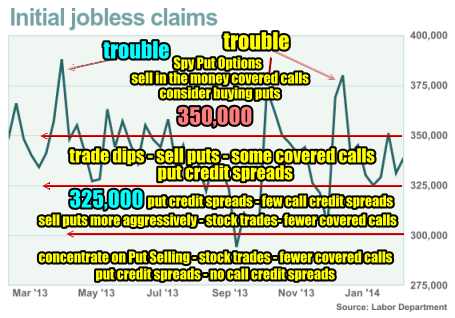
Here is what this market timing system indicates based on today’s Weekly Initial Unemployment Insurance Claims. With the initial jobless claims just below 300,000 the concentration should be on selling put options, stock trades, fewer covered calls unless investors want to be exercised out of their stocks, credit put spreads and no call credit spreads.
Corrections and Bear Markets
As far as this market timing system is concerned, stocks have rarely entered protracted corrections greatly than 15% and no bear markets, in an environment where Weekly Initial Unemployment Insurance Claims are dropping below 300,000.
Today’s numbers are moving toward 300,000. Investors should be aware that a chance in the market can occur above 300,000 for the Weekly Initial Unemployment Insurance Claims.
Raising Cash Levels
Normally, when the Weekly Initial Unemployment Insurance Claims fall below 300,000 the amount of cash invested would be high. However when these weekly numbers begin to steadily climb back toward 300,000 the levels of cash I keep are raised until I am at 35%. I realize that the first move above 300,000 will create more volatility in the stock market. I want to have more cash available for opportunities that may present themselves when volatility is higher. Next week will be important for this market timing system and will determine whether starting to raise cash levels is needed.
Market Timing System Summary
No Market Timing System is perfect and none have been built around zero interest rates. How accurate this market timing system can be in the present zero interest rate environment is difficult to determine. But for what it is worth, this market timing system is continuing to tell investors, be cautious but still trade for opportunities. For myself, I am working my way toward 35% cash but I am still trading in big cap stocks as opportunities appear.
To understand how this market timing system works, read the outline of this full timing system through this link.
Market Timing System Internal Links
Profiting From Understanding Market Direction (Articles Index)
Understanding Short-Term Signals
Market Direction Portfolio Trades (Members)
Market Timing System External Links
IWM ETF Russell 2000 Fund Info
Market Direction SPY ETF 500 Fund Info