A Market Timing System I developed many years ago might seem a bit unusual, but surprisingly it is simple and effective. It is a market timing system that any investor can use. I use this market timing system not to tell me if the market is going to correct strongly or even fall, but to decide how much capital to commit to the stock markets. This market timing system is based on following the USA Initial Unemployment Insurance Claims. This simple market timing system has proved its worth many times over the past 20 years. With information on the internet it is far easier to follow this market timing system today than in the past when I did this by pen and paper.
Market Timing System Background
When an economy is doing well the US Initial Unemployment Insurance Claims decline as more people are finding work and there is less need for Unemployment Insurance Benefits.
When the economy begins to slow down or enter a recession, Initial Unemployment Insurance Claims start to rise. There is usually nothing dramatic at the start but eventually the figures reflect the weakness in job opportunities.
How I Apply This Market Timing System
As a market timing system it works quite well. As long as Initial Unemployment Insurance Claims are rising I reduce the put selling contract sizes I would normally do. As well if I am buying and selling stocks I reduce the quantity of shares I invest in.
Basically I am raising cash levels by investing less during periods when Initial Unemployment Insurance Claims are rising.
The exact opposite occurs when Initial Unemployment Insurance Claims are declining. I increase the number of put options I am selling as I will buy and sell more stock shares.
I am reducing the amount of my cash levels and increasing my stock and option trading as Initial Unemployment Insurance Claims decline. In other words I use more of my cash as long as Initial Unemployment Insurance Claims are declining.
The reason for this market timing system is so I have elevated cash levels to take advantage of declines in stock prices or severe corrections or a collapse.
This Market Timing System Focuses On Cash In Use
Unlike other market timing systems that focus on market direction, I use this market timing system to focus on cash in use.
No market timing system is flawless of course and this one is no different. However the advantage of this market timing system is that I can gradually increase or decrease my cash in use depending on the Initial Unemployment Insurance Claims rising or falling. This means I can move gradually over a period of weeks rather than a few days.
Therefore if the Initial Unemployment Insurance Claims fluctuate month after month I am still always invested to some extent and thereby compounding my capital and still earning income.
If the Initial Unemployment Insurance Claims go from rising to declining and then back to rising again over a period of a few months, my change in stock and option trading is not great enough to make much difference to my overall portfolio and I can continue to benefit from staying partially invested in stocks.
However if the Initial Unemployment Insurance Claims rise and keep rising, I can continue to reduce the amount of cash I have committed to my stock and option positions until the cash not invested far outweighs the amount invested. If the market should fall apart as it did in the fall of 2008, I have a lot of cash out of the stock market and available to take advantage of fire sale prices on stocks.
Applying This Market Timing System
The Initial Unemployment Insurance Claims chart below is from July 2006 to May 2007. To apply this market timing system I keep a running log of the Initial Unemployment Insurance Claims. For this market timing system it isn’t a matter of what the numbers say. It is not a matter of saying that numbers below 300K are good and above 350K bad. Instead this market timing system follows the trend in the numbers. Rising numbers indicate an increasing number of claims and falling numbers a declining number of claims. Rising numbers tell me to pull money out of the stock market and declining numbers to put more money to work. Looking at the chart below you can see the notes I made to myself during this time period. You can also tell that this market timing system does not require a lot of time to implement and follow.
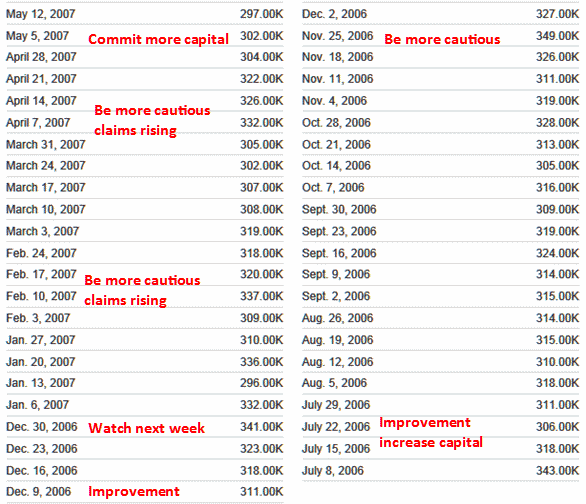
Market Timing System Chart showing Initial Unemployment Insurance Claims from July 2006 to May 2007
Remember that stock markets are not rational. Investors buy heavily at market tops as they believe there is still more upside left.
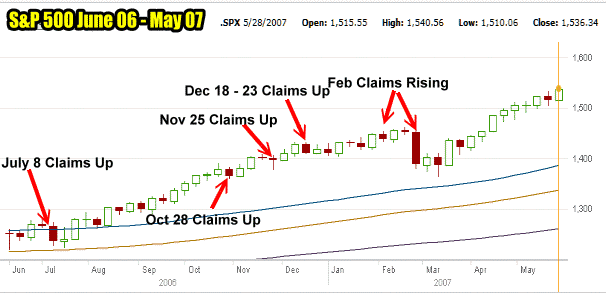
The S&P 500 chart for the same time period
Stock Market 2008 Collapse
The chart below shows the period from May 2007 to April 2008. You can see the notes I made during this period and my note by March that positions should be reduced as Initial Unemployment Insurance Claims were worsening. This is months before the September 2008 stock market collapse.
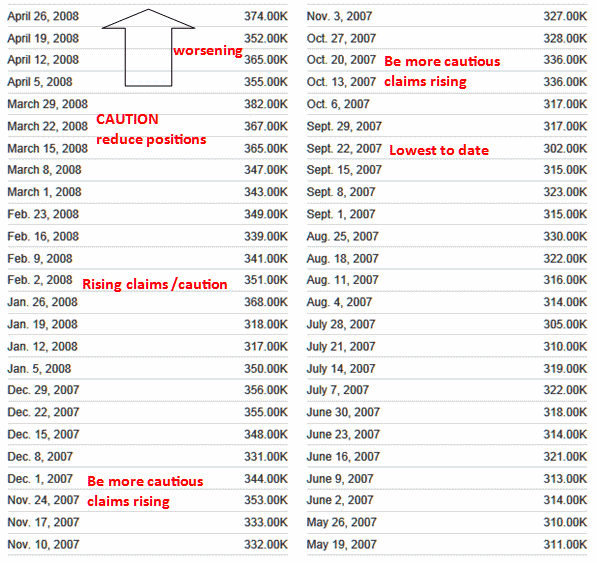
Market Timing System based on Initial Unemployment Insurance Claims showing period from May 2007 to April 2008
In the S&P 500 chart for that same period you can see how the S&P 500 is following the Initial Unemployment Insurance Claims rising. There is the period in September when claims fell and the market rose. But again the co-relation among the Initial Unemployment Insurance Claims and the S&P is obvious as by Oct 2007 claims are rising again and the market falling.
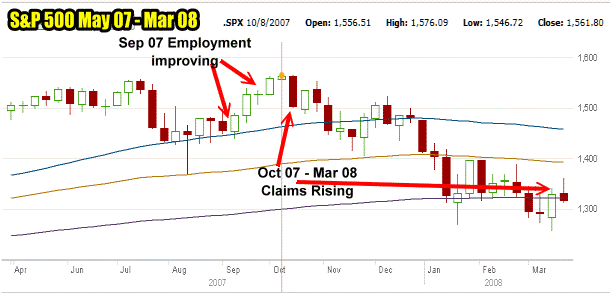
S&P 500 Stock Chart from May 2007 to April 2008
As a market timing system, it is not fool-proof, but you can see the co-relation between the Initial Unemployment Insurance Claims and the S&P. By staying cautious and reducing positions as Initial Unemployment Insurance Claims rise, I have more cash available for when the S&P does turn back up.
Below is the period from May 2008 to April 2009. You can see the continual rise in Initial Unemployment Insurance Claims and of course you know what happened to the S&P.
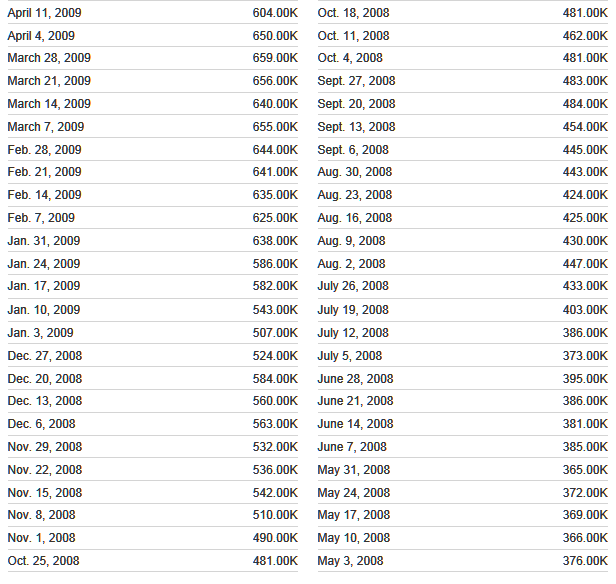
Market Timing System showing the rise in Initial Unemployment Insurance Claims during the market collapse.
2009 Stock Market Recovery
In March the Initial Unemployment Insurance Claims topped out at 659,000 and it stalled there before beginning to decline. This was another clue from this market timing system that the market was on the verge of a move back up. Remember that this market timing system is not based on a low number, but rising claims and declining claims.
The period from April 2009 shows the general decline of Initial Unemployment Insurance Claims which advised that investors should put capital back into stocks. Again you know what happened to the S&P during this period. It commenced the largest rally in more than 75 years.
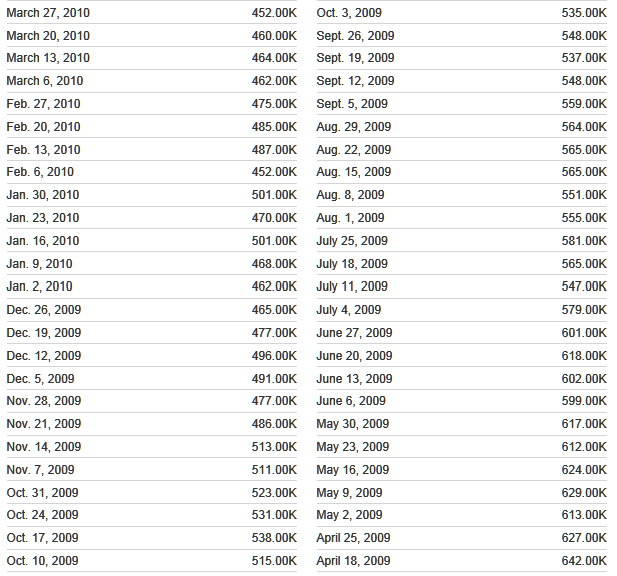
You can see the gradual improvement in unemployment claims which coincided with the rise of stocks from their March 2009 lows.
Market Timing System In 2012
My market timing system was cautious a lot of the time last year. Below is the chart since August. In September and October 2011 with Initial Unemployment Insurance Claims rising the stock market was falling. By December with a gradual improvement in Initial Unemployment Insurance Claims the market commenced rising. The Jan 14 2012 numbers showed good improvement and the S&P started pushing higher and with Initial Unemployment Insurance Claims staying below 380K the market continued to rally into April 2012.
But in April the Initial Unemployment Insurance Claims again rose and the rally stalled out. When the Initial Unemployment Insurance Claims declined in May the market pushed back up but by the end of May with Initial Unemployment Insurance Claims above 380K the rallied stopped and the market commenced a correction.
The latest Initial Unemployment Insurance Claims are back below 380K which could support the S&P. If the numbers decline from here going into the fall I will be putting more capital back into stocks.
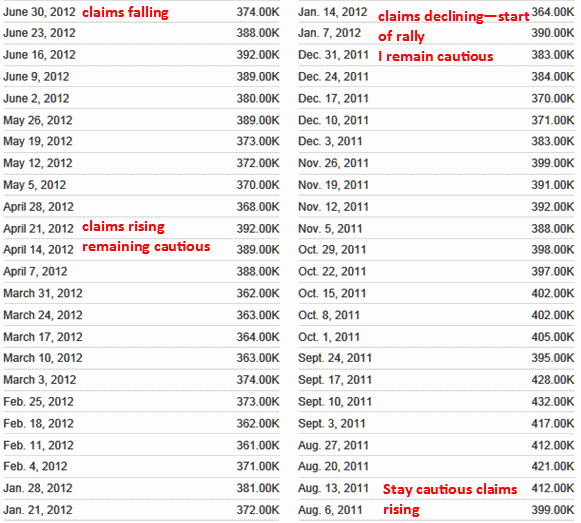
The market timing system from August 2011 to June 2012
Market Timing System Using Initial Unemployment Insurance Claims Summary
Like every system this market timing system is not without errors and wrong calls. But it is a great tool to have in the overall arsenal as I prefer caution to risk when it comes to investing in stocks. I have found it to be a very helpful method to time committing capital into stocks. All of the initial unemployment insurance claims charts are from YCharts which you can reach through this market timing system link.
So remember the rules:
1) Initial unemployment insurance claims continuing to decline I stay invested and commit more capital as rates continue to decline.
2) Initial unemployment insurance claims rise I reduce the amount of capital committed to option selling and reduce the quantity of shares being traded to raise cash.
3) If initial unemployment insurance claims continue to rise I continue to pull back the amount of capital I am exposing to the stock market.
This simple strategy has assisted me for years in my investing objectives. It allows me to determine when to commit more capital to the stock market and when capital needs to be reduced to raise cash to take advantage of possible stock market declines. This market timing system is simple and it works.
