
Prior Trading Day Summary
On Tue Nov 17 2026 stocks continued to come under selling pressure. The sell-off widened on Tuesday with the SPX falling below the 200 day early morning and reaching 7288 before rebounding. The close was still weak with the SPX down 76 points, but overall it had been much worse earlier in the day. Semi-conductors were still under intense selling pressure especially with the NSA reporting a network outage. This created more worries for investors who continue to fear AI and what potential havoc it may cause.
The S&P fell 76 points to close at 7340 on volume of 5.2 billion. This is below the Nov 5 intraday low of 7350. There were 420 new lows and just 17 new highs. 78% of all volume being traded was moving lower and 78% of stocks were falling by the close. Over a third of the index holds stocks that have fallen 20% or more. While the sell-off is not yet a bear market, it certainly feels like one for a lot of stock holders.
After hours NVIDIA Stock (NVDA) rose on the release of strong quarterly earnings. The question now though is will the stock start the day higher but then give back the gains to continue lower. This has been a pattern with quarterly earnings from NVIDIA over the past couple of years. If investors perceive the stock is low enough, we might see a bounce but the present market looks ready to take stocks lower rather than higher.
Today is pivotal as we get to find out what investor reaction will be to NVIDIA earnings and whether the index can turn around or instead fall still lower. Below the 200 day there is limited support until 7200 and then 7000. I have written several times about the importance of the 7200 level to this rally.
Let’s review the technical indicators for the close on Tue Nov 17 2026 to see what they predict for Wed Nov 18 2026.
Stock Market Outlook: SPX Closing Chart For Tue Nov 17 2026
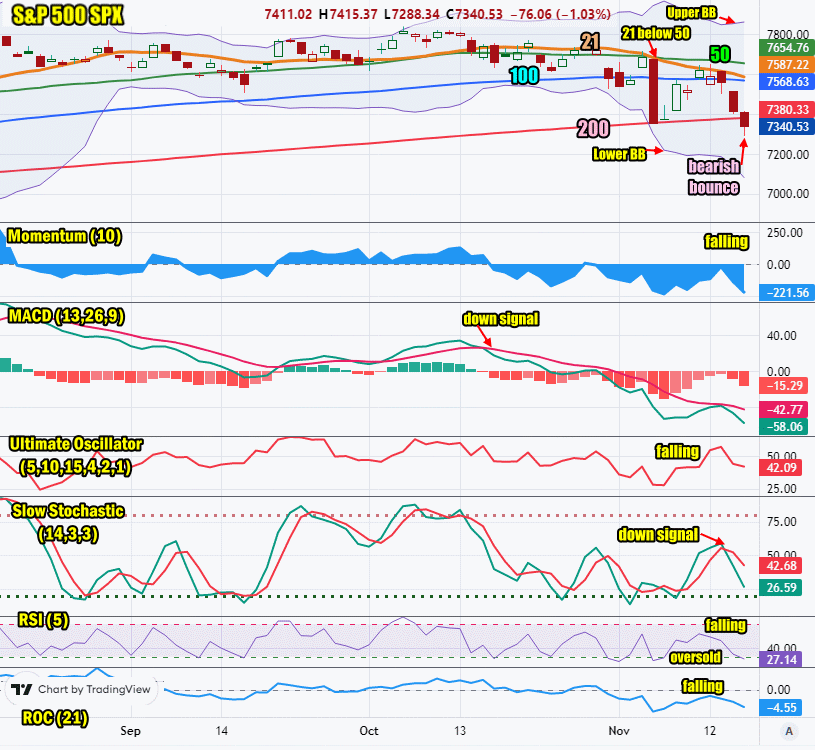
The index ended the day below the Upper Bollinger Band, the 50, 21, 100 and 200 day moving averages. This is very bearish.
The closing candlestick has a long shadow signaling there is a good chance for an oversold bounce on Wednesday.
The 21 day moving average is falling and closed at 7587. It is below the 50 day moving average and nearing the 100 day. This is bearish.
The 50 day moving average is falling and closed at 7654. This is bearish.
The 100 day moving average is unchanged and closed at 7568. This is bearish.
The 200 day moving average is falling and closed at 7380. This is bearish.
The Lower Bollinger Band is below all major moving averages. It is turning lower which at present is bearish.. The Upper Bollinger Band is rising which signals higher volatility lies ahead. The index has many oversold signs but not extremely oversold. Any bounce at present may not last more than a day at most.
The SPX chart is more bearish than bullish for Wednesday.
SPX Stock Market Outlook review of Tue Nov 17 2026
Stock Market Outlook: Technical Indicators Review
Momentum: Momentum is falling and negative. This is bearish.
|
MACD Histogram: MACD (Moving Averages Convergence / Divergence) issued a down signal on Thu Oct 15 2026. The down signal gained strength on Tue Nov 17 2026.
|
Ultimate Oscillator: The Ultimate Oscillator is falling which is bearish.
|
Slow Stochastic: The Slow Stochastic has a down signal in place which is bearish.
|
Relative Strength Index: The RSI signal is falling which is bearish. It is signaling oversold but there is room to fall further.
|
| Rate of Change: The rate of change is falling. It is signaling Wednesday will end lower. Settings: Rate Of Change is set for a 21 period. This indicator looks back 21 days and compares price action from the past to the present. With the Rate Of Change, prices are rising when signals are positive. Conversely, prices are falling when signals are negative. As an advance rises, the Rate Of Change signal should also rise higher, otherwise the rally is suspect. A decline should see the Rate Of Change fall into negative signals. The more negative the signals the stronger the decline. |
Stock Market Outlook: Support and Resistance Levels |
| 7800 is resistance |
| 7780 is resistance |
| 7750 is resistance |
| 7700 is resistance |
| 7650 is resistance |
| 7600 is resistance |
| 7570 is resistance |
| 7550 is resistance |
| 7500 is support |
| 7400 is support |
| 7300 is support |
| 7250 is support |
Stock Market Outlook for Wed Nov 18 2026
Wednesday will be all about the reaction to NVIDIA earnings. After hours on Tuesday many semiconductors jumped higher on the back of strong NVIDIA earnings. That may not last on Wednesday, especially if selling returns to the various semiconductor stocks.
The outlook is bearish with a chance for a bounce but signals do not advise that the index is very oversold. That means any bounce may not last. I am expecting a higher open followed by a lower close.
Potential Economic and Political Market Moving Events
Monday:
8:30 Empire State Manufacturing Survey for Nov was poor coming in at 87.8 well below estimated of 16.7
Tuesday:
8:30 Retail Sales for Oct came in as estimated at 0.2% down from 0.8% prior
8:30 Import Prices for Oct were unchanged at 1.1%
9:15 Industrial Production month to month for Oct came in far worse than estimated, at -0.4%
9:15 Capacity Utilization for Oct was lower than estimated, coming in at 76.4%
Wednesday:
8:30 Housing starts for Oct are estimated to rise to 1.3 million from 1.2 million prior
10:00 Pending home sales month over month are estimated to rise to -1.5% from -7.3% prior
2:00 FOMC latest minutes from the last Fed meeting on interest rates. This is not expect to move markets.