

Prior Trading Day Summary
On Friday Nov 13 2026 stocks were under pressure again as concerns continued over the leaving of NVIDIA CEO Jensen Huang. The stock fell to $158.39 early morning and then managed to climb back to close at $162.85. The S&P closed lower by 30 points to 7561 but for the week the index was up 185 points. This is the best showing since the first week of August when the SPX closed up 268 points. Volume was very low at 4.4 billion shares traded and new lows rose to 306 while there were just 26 new highs. Market breadth remains a prime concern.
The NASDAQ fell 229 points ending the week at 25,136. But it tacked on 556 points on the week making it the best week since the first week of August when the NASDAQ added 1316 points. Volume was average at 9.1 billion but there were 444 new 52 week lows and just 60 new highs. Overall the market breadth is poor on both indexes and has been for a few months. At some point this will catch up to stocks unless there is a convincing move to new highs that brings in more volume.
Let’s review the technical indicators for the close on Fri Nov 13 2026 to see what they predict for the start of the third week of November.
Stock Market Outlook: SPX Closing Chart For Fri Nov 13 2026
The index ended the day below the Upper Bollinger Band, the 50, 21 and the 100 day moving averages. This is bearish.
The closing candlestick has a long shadow warning investors we could see stocks try to jump today or simply move lower ahead of NVIDIA Stock (NVDA) earnings tomorrow.
The 21 day moving average is falling and closed at 7615. It is below the 50 day moving average and nearing the 100 day which is bearish.
The 50 day moving average is falling and closed at 7667. This is bearish.
The 100 day moving average is unchanged and closed at 7576. This is bearish.
The 200 day moving average is rising and closed at 7375. This is bullish.
The Lower Bollinger Band is below all major moving averages. It is turning lower which at present is bearish.. The Upper Bollinger Band is falling which is also bearish.
The SPX chart is more bearish than bullish for Monday.
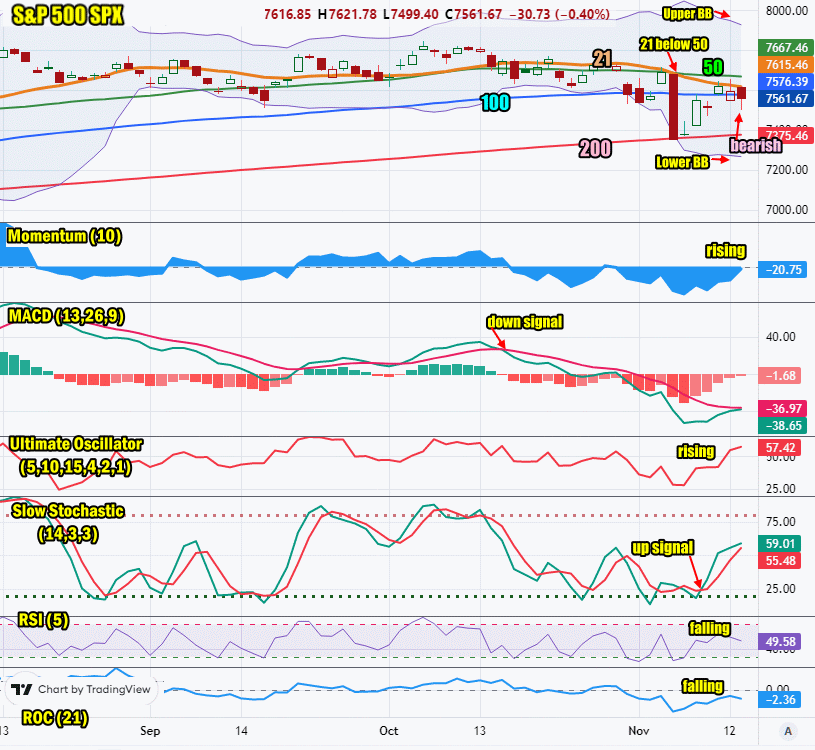
SPX Stock Market Outlook review of Fri Nov 13 2026
Stock Market Outlook: Technical Indicators Review
Momentum: Momentum is rising and negative. This is still bearish but a move back to positive will turn this into a bullish signal.
|
MACD Histogram: MACD (Moving Averages Convergence / Divergence) issued a down signal on Thu Oct 15 2026. The down signal was almost gone on Fri Nov 13 2026.
|
Ultimate Oscillator: The Ultimate Oscillator is rising which is bullish. It is nearing overbought readings.
|
Slow Stochastic: The Slow Stochastic has an up signal in place which is bullish.
|
Relative Strength Index: The RSI signal is falling which is bearish.
|
| Rate of Change: The rate of change is falling. It is signaling Monday will end lower. Settings: Rate Of Change is set for a 21 period. This indicator looks back 21 days and compares price action from the past to the present. With the Rate Of Change, prices are rising when signals are positive. Conversely, prices are falling when signals are negative. As an advance rises, the Rate Of Change signal should also rise higher, otherwise the rally is suspect. A decline should see the Rate Of Change fall into negative signals. The more negative the signals the stronger the decline. |
Stock Market Outlook: Support and Resistance Levels |
| 7800 is resistance |
| 7780 is resistance |
| 7750 is resistance |
| 7700 is resistance |
| 7650 is resistance |
| 7600 is resistance |
| 7570 is resistance |
| 7550 is resistance |
| 7500 is support |
| 7400 is support |
| 7300 is support |
| 7250 is support |
Stock Market Outlook for Mon Nov 16 2026
The major concern has to be the number of 52 week lows and how they keep growing. The index will have to break out in a convincing fashion if it has any hope of drawing in more investors. At present investors are simply trading the swings. Few are risking much capital into long-term positions. On Friday the PPI numbers were disappointing and show that inflation is continuing to rise. Hopefully with the price of oil declining, the inflation numbers will pullback shortly.
For Monday the indicators are more bearish than bullish. NVIDIA Stock (NVDA) earnings tomorrow have to be strong to convince analysts and investors that the stock can move higher without its CEO. That will be a tough sale. Over the weekend a number of analysts changed their outlook to more negative and some picked $125 as a spot to consider trying to pick up some shares. All of this will weigh on stocks today. Overall there is continuing weakness throughout both indexes and all the technical indicators are warning to stay cautious and place only small amounts of capital at risk until the outlook is clearer.
For Monday watch for a bounce attempt which Friday’s closing candlestick predicted. At the same time the same closing candlestick advised there is a better chance for another lower close to start the week off, than any push higher. Stay cautious and keep capital ready for opportunities.
Potential Economic and Political Market Moving Events
Monday:
8:30 Empire State Manufacturing Survey for Nov is estimated to fall to 16.7 versus 25.5 prior