
FullyInformed.com
Generic filters

Stock Market Outlook For Wed Nov 11 2026 – Bounce To Start The Day and Higher Close

Nov 11, 2026 | Stock Market Outlook


Prior Trading Day Summary

On Tue Nov 10 2026 with NVIDIA Stock (NVDA) continuing to fall investors took profits after the latest inflation numbers came in much hotter than estimated.

The S&P closed down 29 points for a mild loss, ending the day at 7520 for a second day back above 7500.

The NASDAQ fell 187 points to close at 25,065. None of the signs on Tuesday pointed to a resumption of last week’s selling.

Let’s review the closing technical indicators from Tue Nov 10 2026 to see the outlook for Wed Nov 11 2026.


Stock Market Outlook: SPX Closing Chart For Tue Nov 10 2026 

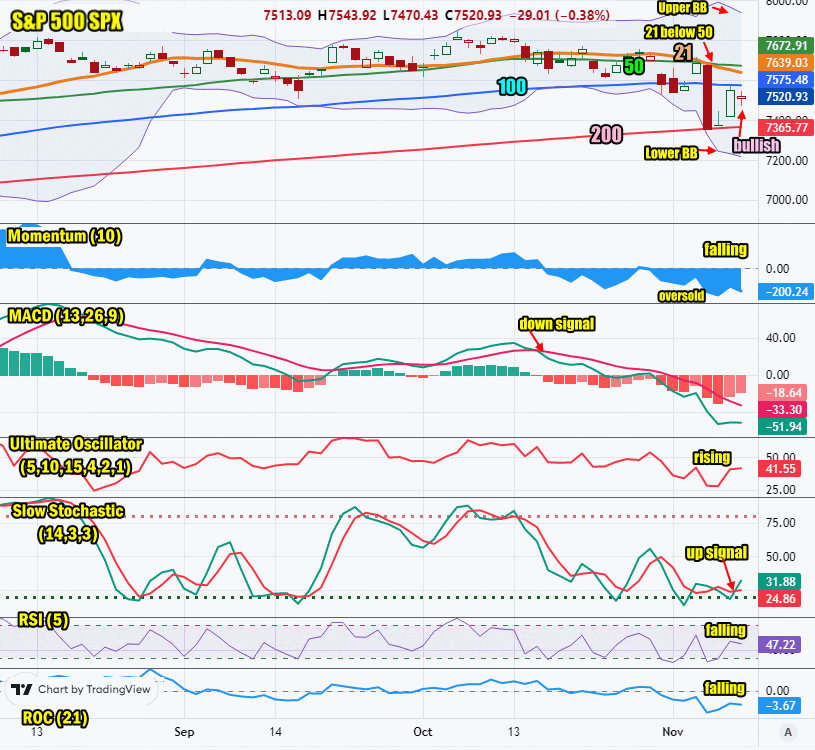
The index ended the day below the Upper Bollinger Band and the 21, 50 and 100 day moving averages but it stayed above the 200 day. This is bullish.

The closing candlestick is indicating that Wednesday will see another bounce attempt and a close higher than Tuesday’s close.

The 21 day moving average is falling and closed at 7639. It is below the 50 day moving average. This is bearish.

The 50 day moving average is falling and closed at 7672. This is bearish.

The 100 day moving average is falling and closed at 7575. This is bearish.

The 200 day moving average is rising and closed at 7365. This is bullish.

The Lower Bollinger Band is below all major moving averages. The break of the 200 day is a bearish signal. The Upper Bollinger Band is falling which is bearish.

The SPX chart is more bearish than bullish for Wednesday.
SPX Stock Market Outlook review of Tue Nov 10 2026


Stock Market Outlook: Technical Indicators Review

Momentum: Momentum isr ising and negative. This is bearish. Readings are at oversold levels.

  • Settings: For momentum I use a 10 period when studying market direction.
MACD Histogram: MACD (Moving Averages Convergence / Divergence) issued a down signal on Thu Oct 15 2026. The down signal was weaker on Tue Nov 10 2026.

  • Settings: For MACD Histogram, I am using the Fast Points set at 13, Slow Points at 26 and Smoothing at 9.
Ultimate Oscillator: The Ultimate Oscillator is rising which is bullish.

  • Settings: The Ultimate Oscillator settings are: Period 1 is 5, Period 2 is 10, Period 3 is 15, Factor 1 is 4, Factor 2 is 2 and Factor 3 is 1. These are not the default settings but are the settings I use with the S&P 500 chart set for 1 to 3 months.
Slow Stochastic: The Slow Stochastic has a weak up signal in place which is bullish. It is at oversold levels.

  • Settings: For the Slow Stochastic I use the K period of 14 and D period of 3. The Slow Stochastic tries to predict the market direction further out than just one day.
Relative Strength Index: The RSI signal is falling and bearish.

  • Settings: The relative strength index is set for a period of 5 which gives it 5 days of market movement to monitor. It is often the first indicator to show an overbought or oversold signal.
Rate of Change: The rate of change is falling. It is signaling Wednesday will end lower.

Settings: Rate Of Change is set for a 21 period. This indicator looks back 21 days and compares price action from the past to the present. With the Rate Of Change, prices are rising when signals are positive. Conversely, prices are falling when signals are negative. As an advance rises, the Rate Of Change signal should also rise higher, otherwise the rally is suspect. A decline should see the Rate Of Change fall into negative signals. The more negative the signals the stronger the decline.


Stock Market Outlook: Support and Resistance Levels

7800 is resistance
7780 is resistance
7750 is resistance
7700 is resistance
7650 is resistance
7600 is resistance
7570 is resistance
7550 is resistance
7500 is support
7400 is support
7300 is support
7250 is support


Stock Market Outlook for Wed Nov 11 2026 

The inflation numbers on Tuesday were higher than estimated but not a huge jump. The media made more about the inflation numbers than most investors. Still, the day saw a parade of Fed officials discussing another rate hike for December including a possible half point rate hike although at present, analysts believe that is not likely.

Volume in NVIDIA Stock (NVDA) showed a lot of buying at lower levels was taking place today. After hours the stock rose. If NVIDIA Stock (NVDA) rises today, it will draw in more investors and more stocks. I expect a higher open today followed by weakness and then a higher close. The technical indicators are still strongly negative and are cautioning that stocks could fall still further. I am keeping trades smaller than usual until there are clearer signals to the upside.


Potential Economic and Political Market Moving Events

Monday:

10:00 Monthly Wholesale Trade for Sep was higher than estimated at 0.7%

Tuesday:

8:30 Consumer Price Index (CPI) for October was higher than estimated at 0.4%

8:30 Core CPI for Oct is rose to 0.3% higher than estimated

8:30 CPI Year-Over-Year for Oct was not reported due to the Oct 2025 government shut down

8:30 CPI Core year-over-year for Oct was not reported due to the Oct 2025 government shut down

Wednesday:

No reports


Recent Outlooks

Morning Investing Strategy Notes for Tue Nov 10 2026

For FullyInformed Members the morning Investing Strategy Notes for Tue Nov 10 2026 discuss the outlook for Tuesday along with comments and trade tips for NVIDIA Stock (NVDA). Equities reviewed today include SQQQ ETF, TQQQ ETF, NVIDIA Stock (NVDA), Coreweave …

Stock Market Outlook For Tue Nov 10 2026 – Some Weakness Possible But Higher Close Expected

Prior Trading Day Summary On Tuesday stocks continued their recovery with the SPX reaching the 100 day and then closing just below it. BY the end of the day the SPX had recovered all but 30 points on the loss …

Morning Investing Strategy Notes for Mon Nov 9 2026

For FullyInformed Members the morning Investing Strategy Notes for Mon Nov 9 2026 discuss tthe outlook for the start of the second week of November. Equities reviewed today include SQQQ ETF, TQQQ ETF, Berkshire Hathaway Stock (BRK.B), Take Two Interactive …

Stock Market Outlook For Mon Nov 9 2026 – Nice Bounce But Lower To Start The Week

Prior Trading Day Summary On Friday investors tried to recover a bit of Thursday’s plunge but it will take more than a day to recover this large a fall. The S&P closed up 23 points to end the day at …

Morning Investing Strategy Notes for Fri Nov 6 2026

For FullyInformed Members the morning Investing Strategy Notes for Fri Nov 6 2026 discuss the market sell-off and subsequent collapse of equities on Thursday. Equities reviewed today include SQQQ ETF, TQQQ ETF, Berkshire Hathaway Stock (BRK.B) and more. The morning …

Stock Market Outlook For Fri Nov 6 2026 – Bounce Likely But Lower Even With The Oct Jobs Numbers

Prior Trading Day Summary On Thu Nov 5 2026 from the very start selling erupted as investors gave back the rallies from Wednesday and pummeled tech stocks in particular. The SMH ETF VanEck Semiconductor had its worse single day since …

Morning Investing Strategy Notes for Thu Nov 5 2026

For FullyInformed Members the morning Investing Strategy Notes for Thu Nov 5 2026  discuss Wednesday’s rally. Equities reviewed today include AIRBNB Stock (ABNB), Moderna Stock (MRNA), TQQQ ETF, SQQQ ETF and more. The morning Investing Strategy Notes are for FullyInformed …

Stock Market Outlook For Thu Nov 5 2026 – Choppy Dip Possible Ahead Of October Non-Farm Payroll Numbers

Prior Trading Day Summary On Wed Nov 4 2026 stocks soared higher on the back of the mid-term elections being completed and the results being accepted by President Trump. This meant for investors that the mid-term concerns were over no …

Morning Investing Strategy Notes for Wed Nov 4 2026

For FullyInformed Members the morning Investing Strategy Notes for Wed Nov 4 2026 discuss Tuesday’s bounce and the outlook for equities following the mid-term elections. Equities reviewed today include Advanced Micro Devices Stock (AMD), ARM Stock (ARM), Qualcomm Stock (QCOM) …

Stock Market Outlook For Wed Nov 4 2026 – Lower Following Mid-Terms

Prior Trading Day Summary On Tue Nov 3 2026 stocks attempted a second bounce. While strength was limited, the SPX and NASDAQ managed to close positive ahead of the mid-terms. The S&P closed up 27 points to end the day …

Morning Investing Strategy Notes for Tue Nov 3 2026

For FullyInformed Members the morning Investing Strategy Notes for Tue Nov 3 2026 discuss Monday’s lost bounce and the outlook for today and Wednesday. Equities reviewed today include Apple Stock (AAPL), Palantir Tech Stock (PLTR), Advanced Micro Devices Stock (AMD), …

Stock Market Outlook For Tue Nov 3 2026 – 2nd Bounce Possible But Mid-Terms Dominate

Prior Trading Day Summary On Mon Nov 2 2026 stocks opened higher and tried to build on the early rally. But as explained in yesterday’s outlook, the bounce on Monday would have a hard time holding its gains with the …

Morning Investing Strategy Notes for Mon Nov 2 2026

For FullyInformed Members the morning Investing Strategy Notes for Mon Nov 2 2026 discuss Friday’s sell-off and the outlook for November. Included are some investing tips for sell-offs. Equities reviewed today include Apple Stock (AAPL), Shopify Stock (SHOP), Palantir Tech …

Stock Market Outlook For Mon Nov 2 2026 – Bounce Likely After Friday’s Sell-Off and Ahead of Mid-Terms

Prior Trading Day Summary On Fri Oct 30 2026 stocks plunged as the ai trade took another hit. Tech stocks took the brunt of the sell-off which saw the S&P lose 140 points for a drop of 1.82% and a …

Subscribe For The Latest News