
Prior Trading Day Summary
On Friday investors tried to recover a bit of Thursday’s plunge but it will take more than a day to recover this large a fall.
The S&P closed up 23 points to end the day at 7376. Volume fell back to 5.8 billion shares a drop of 1.9 billion shares from Thursday. 50% of all volume was rising and 48% was falling, an indication of the indecision on Friday.
The NASDAQ rose 264 points as some investors picked through beaten down tech names. The index closed at 24,579. Volume dropped to 10.9 billion shares traded from Thursday’s 13.6 billion. 63% of all volume was being traded higher and 58% of stocks were climbing.
Let’s review the closing technical indicators from Fri Nov 6 2026 to see how Monday may end up.
Stock Market Outlook: SPX Closing Chart For Fri Nov 6 2026
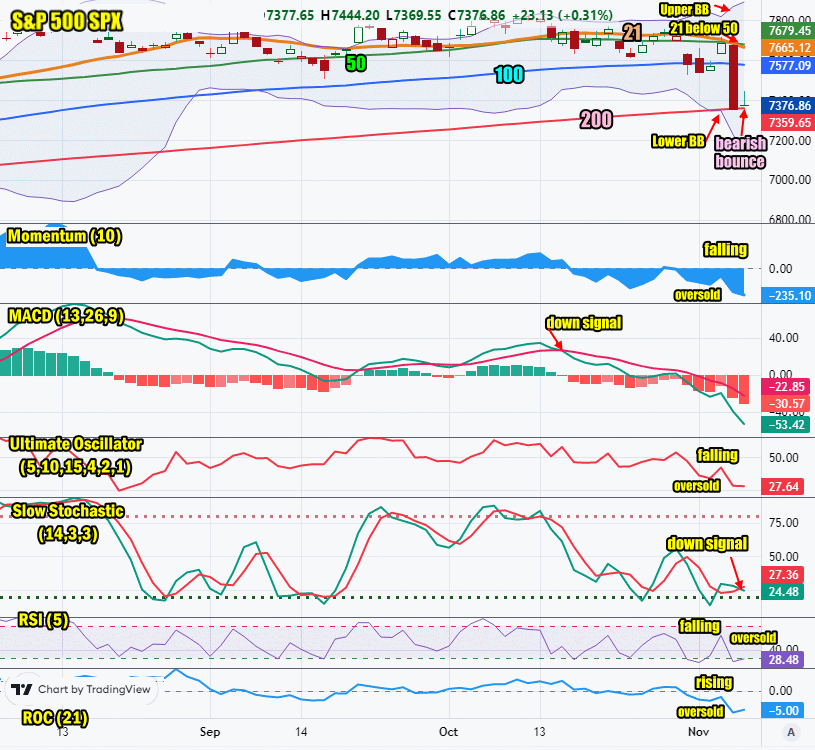
The index ended the day below the Upper Bollinger Band and the 21, 50 and 100 day moving averages. It ended at the 200 day moving average. The SPX is not down 10% at present.
The closing candlestick is indicating that Friday saw some buying but the close saw much of the buying end. The candlestick indicates this is a bearish bounce.
The 21 day moving average is falling and closed at 7665. It is below the 50 day moving average. This is bearish.
The 50 day moving average is falling and closed at 7679. This is bearish.
The 100 day moving average is falling and closed at 7577. This is bearish.
The 200 day moving average is rising and closed at 7359. This is bullish.
The Lower Bollinger Band is below the 21, 50 100 day moving averages. It is down below the 200 day. This is negative for stocks. The Upper Bollinger Band is rising which at present is bullish.
The SPX chart is strongly bearish for Mon Nov 9 2026.
SPX Stock Market Outlook review of Fri Nov 6 2026
Stock Market Outlook: Technical Indicators Review
Momentum: Momentum is falling and negative. This is bearish. Readings are at oversold levels.
|
MACD Histogram: MACD (Moving Averages Convergence / Divergence) issued a down signal on Thu Oct 15 2026. The down signal was stronger on Fri Nov 6 2026.
|
Ultimate Oscillator: The Ultimate Oscillator is falling which is bearish It is signaling oversold.
|
Slow Stochastic: The Slow Stochastic has a weak down signal in place which is bearish. It is also at oversold readings.
|
Relative Strength Index: The RSI signal is falling and bearish. It is signaling oversold.
|
| Rate of Change: The rate of change is rising and oversold. There is a chance of a bounce on Monday. Settings: Rate Of Change is set for a 21 period. This indicator looks back 21 days and compares price action from the past to the present. With the Rate Of Change, prices are rising when signals are positive. Conversely, prices are falling when signals are negative. As an advance rises, the Rate Of Change signal should also rise higher, otherwise the rally is suspect. A decline should see the Rate Of Change fall into negative signals. The more negative the signals the stronger the decline. |
Stock Market Outlook: Support and Resistance Levels |
| 7800 is resistance |
| 7780 is resistance |
| 7750 is resistance |
| 7700 is resistance |
| 7650 is resistance |
| 7600 is resistance |
| 7570 is resistance |
| 7550 is resistance |
| 7500 is support |
| 7400 is support |
| 7300 is support |
| 7250 is support |
Stock Market Outlook for Mon Nov 9 2026
Friday was a result of the market being oversold after such a large plunge. Today the index will slip lower and more selling is anticipated.
The index should fall below the 200 day moving average and close below it.
Potential Economic and Political Market Moving Events
Monday:
10:00 Monthly Wholesale Trade for Sep is estimated unchanged at 0.5$