

Prior Trading Day Summary
On Mon Nov 16 2026 stocks fell yet again as investors continued their worry over the tech trade and NVIDIA. With worries continuing investors were taking some profits and reducing their overall exposure to the market.
Monday saw the S&P within easy reach of the 200 day moving average. A break below the 200 day would be a drop of 5.9% from the Oct 6 close of 7844 and mark a correction for the index. Remember though corrections can easily fall from 10% to 19% and not be a bear market. The accepted threshold is a 20% lower close and while market breadth is terrible with decliners far outpacing advancers daily, this is still a correction.
The NASDAQ closed down 626 points to 24,509 which is 11.5% from the 52 week high of $27722.75 made on October 6th (2026).
Let’s review the technical indicators for the close on Mon Nov 16 2026 to see what they predict for Tue Nov 17 2026 as investors prepare for NVIDIA earnings to be released after the close today.
Stock Market Outlook: SPX Closing Chart For Mon Nov 16 2026
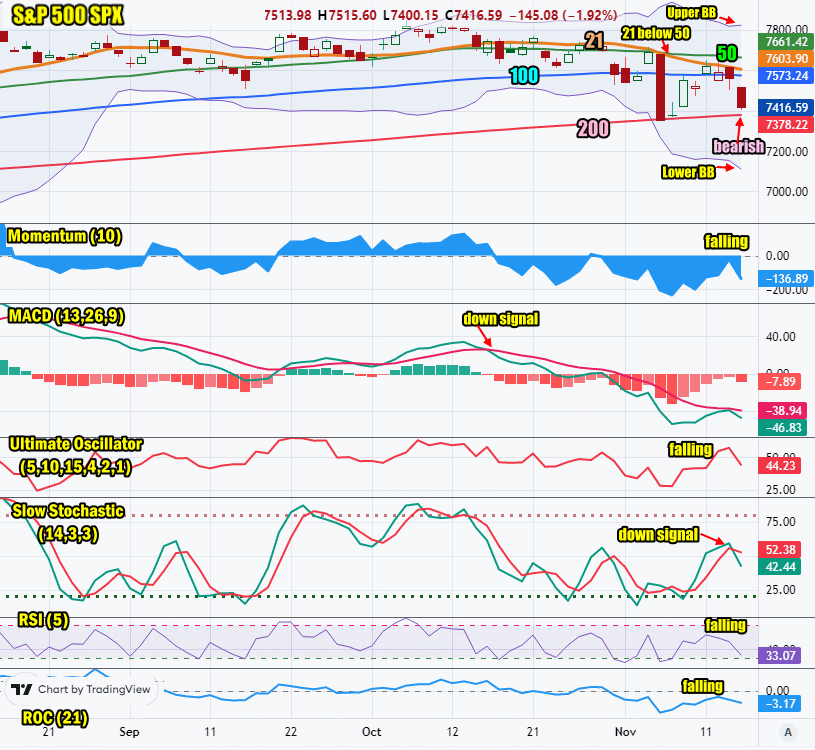
The index ended the day below the Upper Bollinger Band, the 50, 21 and the 100 day moving averages. It is near the 200 day. This is bearish.
The closing candlestick has a small shadow warning investors dips are likely but the chance of a bounce is slim on Tuesday.
The 21 day moving average is falling and closed at 7603. It is below the 50 day moving average and nearing the 100 day which is bearish.
The 50 day moving average is falling and closed at 7661. This is bearish.
The 100 day moving average is unchanged and closed at 7573. This is bearish.
The 200 day moving average is rising and closed at 7378. This is bullish.
The Lower Bollinger Band is below all major moving averages. It is turning lower which at present is bearish.. The Upper Bollinger Band was falling but turned sideways which can signal a bounce coming or an end to the downturn.
The SPX chart is more bearish than bullish for Tuesday.
SPX Stock Market Outlook review of Mon Nov 16 2026
Stock Market Outlook: Technical Indicators Review
Momentum: Momentum is falling and negative. This is bearish.
|
MACD Histogram: MACD (Moving Averages Convergence / Divergence) issued a down signal on Thu Oct 15 2026. The down signal gained a lot of strength on Mon Nov 16 2026.
|
Ultimate Oscillator: The Ultimate Oscillator is falling which is bearish.
|
Slow Stochastic: The Slow Stochastic has a down signal in place which is bearish.
|
Relative Strength Index: The RSI signal is falling which is bearish. It is starting to enter oversold readings.
|
| Rate of Change: The rate of change is falling. It is signaling Tuesday will end lower. Settings: Rate Of Change is set for a 21 period. This indicator looks back 21 days and compares price action from the past to the present. With the Rate Of Change, prices are rising when signals are positive. Conversely, prices are falling when signals are negative. As an advance rises, the Rate Of Change signal should also rise higher, otherwise the rally is suspect. A decline should see the Rate Of Change fall into negative signals. The more negative the signals the stronger the decline. |
Stock Market Outlook: Support and Resistance Levels |
| 7800 is resistance |
| 7780 is resistance |
| 7750 is resistance |
| 7700 is resistance |
| 7650 is resistance |
| 7600 is resistance |
| 7570 is resistance |
| 7550 is resistance |
| 7500 is support |
| 7400 is support |
| 7300 is support |
| 7250 is support |
Stock Market Outlook for Tue Nov 17 2026
Market breadth is strongly bearish with the number of 52 week new lows rising swiftly and new highs relegated to a handful of stocks.
The only thing that looks reasonably decent for the bulls is the Upper Bollinger Band turning sideways which often signals a bounce is coming. The other indicators are all bearish which often means the market is entering oversold and could bounce.
For Tuesday though a bounce won’t hold. NVIDIA earnings are tonight after the close. They will have to be incredibly strong and blow away all estimates if the stock will try for any kind of recovery. On Monday it looked very week and signs are pointing to the stock falling to $140 shortly if there isn’t any relief from the selling pressure.
Today though will be all about investors getting set for tonight’s NVIDIA earnings. That means dips are likely and a lower close is expected.
Potential Economic and Political Market Moving Events
Monday:
8:30 Empire State Manufacturing Survey for Nov was poor coming in at 87.8 well below estimated of 16.7
Tuesday:
8:30 Retail Sales for Oct are estimated to have fallen to 0.2% from 0.8% prior
8:30 Import Prices for Oct are estimated to have fallen to 0.7% from 1.1% prior
9:15 Industrial Production month to month for Oct is estimated at just 0.1% down from 0.7% prior
9:15 Capacity Utilization for Oct is estimated to fall to 76.8% from 76.9% prior