

Prior Trading Day Summary
As expected, Thu Nov 12 2026 opened lower on news of the resignation of CEO Huang but then the index spent the day recovering to close down just $7.54 or 4.34%. This is a bullish signal that the stock may try to pop higher today.
The SPX rose 27 points to close at 7592. Volume was 4.8 billion shares traded which is slightly below average. 81% of volume being traded was lower and 77% of all stocks were lower by the close.
The NASDAQ fell 100 points on another heavy day of trading with 11 billion shares. By the close 65% of volume was being traded lower and 74% of all stocks on the index were lower.
NVIDIA Stock (NVDA) fell to below $150 early and then fought its way back to close at $166.19, a remarkable comeback. Volume traded was 6 times the average daily volume with more than 740 million shares traded. Market cap ended the day around $5.53 trillion.
Let’s review the closing technical indicators from Thu Nov 12 2026 to see the outlook for Fri Nov 13 2026.
Stock Market Outlook: SPX Closing Chart For Thu Nov 12 2026
The index ended the day below the Upper Bollinger Band, the 50 and 21 day moving averages but at the 100 day. This is bearish.
The closing candlestick is indicating that Friday will see selling in the morning but a higher close is anticipated.
The 21 day moving average is falling and closed at 7624. It is below the 50 day moving average which is bearish.
The 50 day moving average is falling and closed at 7671. This is bearish.
The 100 day moving average is unchanged and closed at 7576. This is bearish.
The 200 day moving average is rising and closed at 7372. This is bullish.
The Lower Bollinger Band is below all major moving averages. It is turning sideways which at present is bearish.. The Upper Bollinger Band is falling which is bearish.
The SPX chart is more bearish than bullish for Friday.
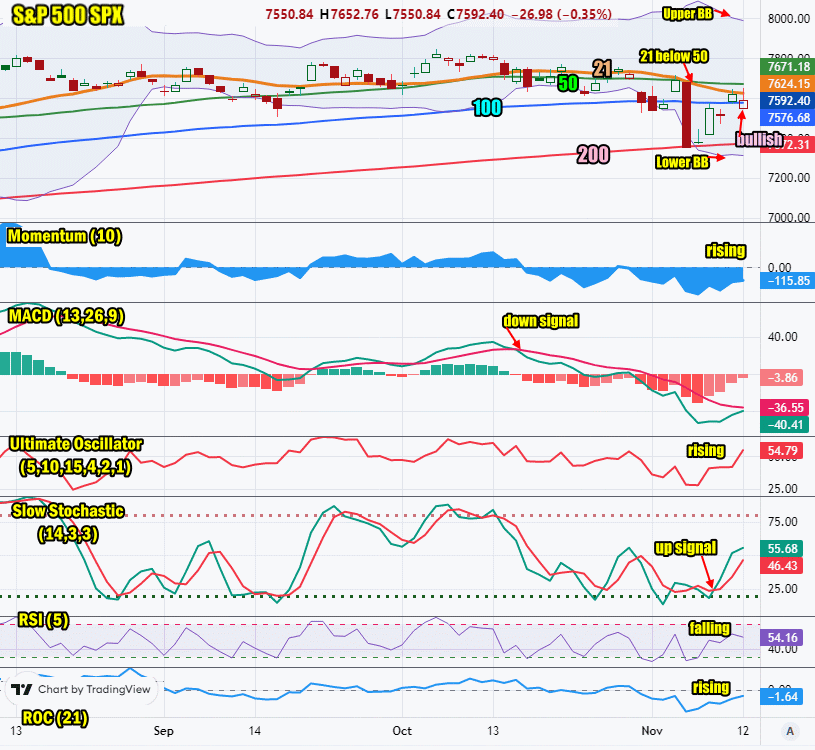
SPX Stock Market Outlook review of Thu Nov 12 2026
Stock Market Outlook: Technical Indicators Review
Momentum: Momentum is rising and negative. This is bearish.
|
MACD Histogram: MACD (Moving Averages Convergence / Divergence) issued a down signal on Thu Oct 15 2026. The down signal was weaker on Thu Nov 12 2026.
|
Ultimate Oscillator: The Ultimate Oscillator is rising which is bullish.
|
Slow Stochastic: The Slow Stochastic has an up signal in place which is bullish.
|
Relative Strength Index: The RSI signal is falling which is bearish.
|
| Rate of Change: The rate of change is rising. It is signaling Friday will end higher. Settings: Rate Of Change is set for a 21 period. This indicator looks back 21 days and compares price action from the past to the present. With the Rate Of Change, prices are rising when signals are positive. Conversely, prices are falling when signals are negative. As an advance rises, the Rate Of Change signal should also rise higher, otherwise the rally is suspect. A decline should see the Rate Of Change fall into negative signals. The more negative the signals the stronger the decline. |
Stock Market Outlook: Support and Resistance Levels |
| 7800 is resistance |
| 7780 is resistance |
| 7750 is resistance |
| 7700 is resistance |
| 7650 is resistance |
| 7600 is resistance |
| 7570 is resistance |
| 7550 is resistance |
| 7500 is support |
| 7400 is support |
| 7300 is support |
| 7250 is support |
Stock Market Outlook for Fri Nov 13 2026
If you look at the number of 52 week highs versus 52 week lows, the lows have dominated since the first week of September except for one day. This advises tha despite the market holding a bullish bias investors have not made break outs on the majority of stocks. Staying cautious is advised as the index tries to find the reasons to push stocks higher.
On Friday watch for the index to open lower and then attempt to recover. Dips may be ahead for the SPX but the overall underlying trend is bullish.
Potential Economic and Political Market Moving Events
Monday:
10:00 Monthly Wholesale Trade for Sep was higher than estimated at 0.7%
Tuesday:
8:30 Consumer Price Index (CPI) for October was higher than estimated at 0.4%
8:30 Core CPI for Oct is rose to 0.3% higher than estimated
8:30 CPI Year-Over-Year for Oct was not reported due to the Oct 2025 government shut down
8:30 CPI Core year-over-year for Oct was not reported due to the Oct 2025 government shut down
Wednesday:
No reports
Thursday:
8:30 Weekly Initial Unemployment Insurance Claims for Nov 7 week jumped to 200,000 higher than estimated
10:00 Existing home sales for Oct came in as estimated at 3.8 billion.
2:00 Monthly Treasury Balance for Oct was far worse than expected coming in at -$404 billion versus -$27 billion prior
Friday:
8:30 Producer Price Index for Oct is estimated at 0.4% from 1.3% prior
8:30 PPI year-over-year came in at 6.6% versus 6.3% prior