

Prior Trading Day Summary
On Wed Nov 11 2026 NVIDIA Stock (NVDA) bounced and Coreweave Stock (CRWV) soared higher. Apple Stock made a new all-time high and stocks rallied throughout the day. I had expected a bounce in the morning and then a bit of weakness but a higher close. Instead the SPX spent the day higher and closed up 98 points to end the day at 7619. Volume was low at 4.6 billion which was a bit disappointing as it showed that a number of investors were sitting out the rally. Still, up volume was 57% and 52% of all stocks were higher by the close. The problem though will be the plunge in NVIDIA Stock (NVDA) expected at the open on Thu Nov 12 2026 as the board decides whether to oust CEO Huang.
The NASDAQ rose 400 points to end the day at 25,466. This is just above where the index was trading on Nov 3. Volume was 11.4 billion with 82% of those shares being traded higher. 62% of all stocks were rising by the close. Overall the NASDAQ was more bullish on Wednesday than the SPX.
Unfortunately starting in the morning today the markets will open lower but there is a chance investors may look beyond the NVIDIA issues with their CEO and take advantage of the early morning dip that is anticipated.
Let’s review the closing technical indicators from Wed Nov 11 2026 to see the outlook for Thu Nov 12 2026.
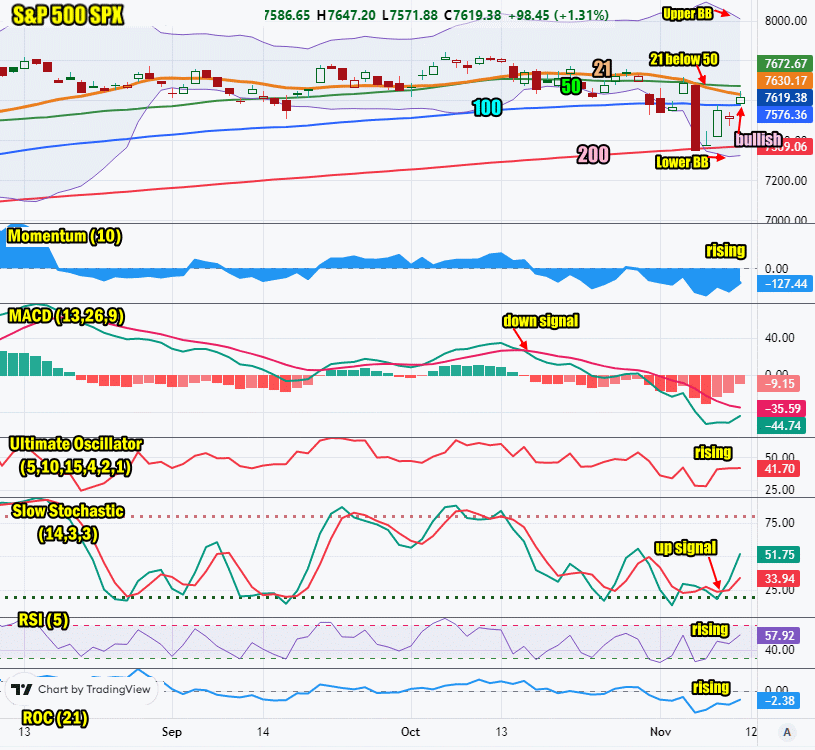
Stock Market Outlook: SPX Closing Chart For Wed Nov 11 2026
The index ended the day below the Upper Bollinger Band, the 50 and 21 day moving averages but above the 100 day and just below the 21 day. This is bullish.
The closing candlestick is indicating that Thursday will see some selling as there is a shadow on the top of the candlestick at the close. The index also failed to break through the 21 day moving average which is still falling. This is bearish.
The 21 day moving average is falling and closed at 7630. It is below the 50 day moving average which is bearish.
The 50 day moving average is unchanged and closed at 7672. This is bearish.
The 100 day moving average is rising and closed at 7576. This is bullish.
The 200 day moving average is rising and closed at 7369. This is bullish.
The Lower Bollinger Band is below all major moving averages. It is turning sideways which at present is bearish.. The Upper Bollinger Band is falling which is bearish.
The SPX chart is more bearish than bullish for Thursday but the bulls are showing some strength returning.
SPX Stock Market Outlook review of Wed Nov 11 2026
Stock Market Outlook: Technical Indicators Review
Momentum: Momentum is rising and negative. This is bearish.
|
MACD Histogram: MACD (Moving Averages Convergence / Divergence) issued a down signal on Thu Oct 15 2026. The down signal was weaker on Wed Nov 11 2026.
|
Ultimate Oscillator: The Ultimate Oscillator is rising which is bullish.
|
Slow Stochastic: The Slow Stochastic has an up signal in place which is bullish.
|
Relative Strength Index: The RSI signal is rising and bullish.
|
| Rate of Change: The rate of change is rising. It is signaling Thursday will end higher. Settings: Rate Of Change is set for a 21 period. This indicator looks back 21 days and compares price action from the past to the present. With the Rate Of Change, prices are rising when signals are positive. Conversely, prices are falling when signals are negative. As an advance rises, the Rate Of Change signal should also rise higher, otherwise the rally is suspect. A decline should see the Rate Of Change fall into negative signals. The more negative the signals the stronger the decline. |
Stock Market Outlook: Support and Resistance Levels |
| 7800 is resistance |
| 7780 is resistance |
| 7750 is resistance |
| 7700 is resistance |
| 7650 is resistance |
| 7600 is resistance |
| 7570 is resistance |
| 7550 is resistance |
| 7500 is support |
| 7400 is support |
| 7300 is support |
| 7250 is support |
Stock Market Outlook for Thu Nov 12 2026
The market sell-off has been recovered which is amazing. I had expected weeks to around a month for the index to rebound and I felt it would move to around 7200 on the SPX which did not happen. The outlook based on the technical indicators above is more bullish than bearish but NVIDIA Stock (NVDA) will weigh on stocks today. It may weigh on stocks tomorrow as well. There is always the possibility that investors may begin to scale into some positions with the stock below $160. The problem is how low can the stock go before it finds solid buying. That could be below $150 at perhaps $140 to $145. At present the stock is into strong support but if things fail to improve for NVIDIA, buyers may stay on the sidelines. Overall though I think the stock will rebound especially if the CEO steps aside. Much of what a business does is about confidence. When it comes to AI and chips, NVIDIA is in a league of its own right now. The board is focused on winning back investor confidence. Once that is restored, sentiment will shift. NVDA will bounce back.
For Thursday watch for the morning drop but then look for the market to try to rebound. The end of the day is expected to be lower but there are a lot of stocks that are in uptrends and that will help the index today and Friday.
Potential Economic and Political Market Moving Events
Monday:
10:00 Monthly Wholesale Trade for Sep was higher than estimated at 0.7%
Tuesday:
8:30 Consumer Price Index (CPI) for October was higher than estimated at 0.4%
8:30 Core CPI for Oct is rose to 0.3% higher than estimated
8:30 CPI Year-Over-Year for Oct was not reported due to the Oct 2025 government shut down
8:30 CPI Core year-over-year for Oct was not reported due to the Oct 2025 government shut down
Wednesday:
No reports
Thursday:
8:30 Weekly Initial Unemployment Insurance Claims for Nov 7 week are estimated to rise to 195,000
10:00 Existing home sales for Oct are estimated to fall to 3.8 million from 4.0 million prior
2:00 Monthly Treasury Balance for Oct is estimated at -28 billion.