

Tuesday saw stocks collapse again under the weight of SNAP’s outlook for revenue from advertising. With a dire outlook for social media ad revenue, SNAP collapsed 43%, Meta Stock (FB) lost 7%, Alphabet Stock (GOOGL) lost 5%, Twitter Stock (TWTR) lost 5% and Pinterest Stock (PINS) lost 23% to mention some of the casualties.
The selling started at the open and quickly broke through the 3900 support level, falling rapidly to 3878 early morning. That marked the low of the day and for the remainder, the indexes struggled back.
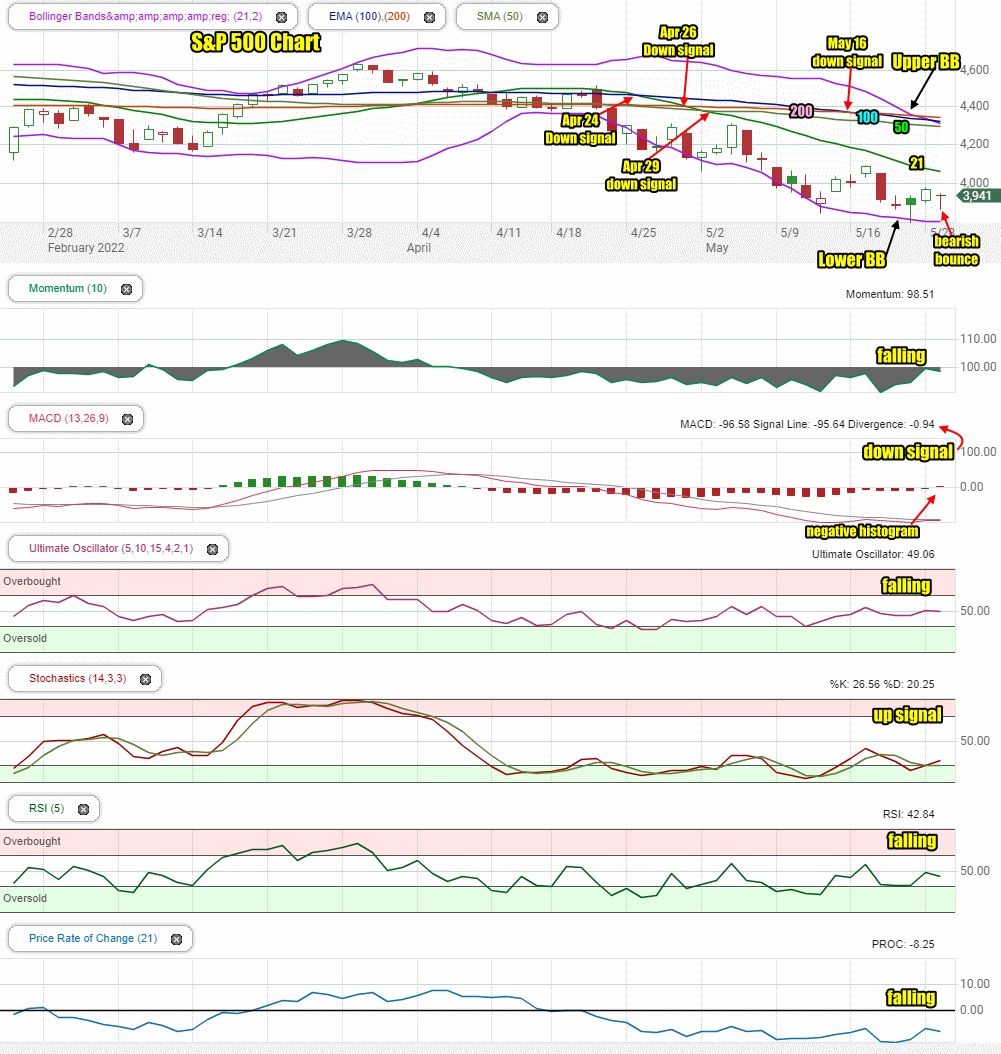
The S&P ended down 32 points to 3941, once again back above the important 3900 support level.
The NASDAQ took the brunt of the selling and ended down 270 points wiping out Monday’s gain. It ended the day at 11,264.
The Dow Jones reversed an early morning plunge and ended the day positive, up 48 points to 31,928. The Dow Jones remains the strongest of the three indexes, down 13.6% from its all-time high.
Let’s review the closing technical indicators from Tuesday’s whipsaw day to see what potential there is for another attempt to bounce on Wednesday.
Stock Market Outlook Chart Comments At The Close on Tue May 24 2022
On Tuesday the closing candlestick is signaling a bearish bounce for a third time. This means we could see yet another attempt to push higher on Wednesday morning but probably fail either later in the day or this week.
The Upper Bollinger Band is falling sharply and is now below both the 200 and 100 day moving averages and approaching falling below the 50 day. This is bearish and advises there is still more risk to the downside.
The Lower Bollinger Band is sill trying to turn sideways but continues to slip lower.
All moving averages are bearish and there was a new sell signal on Monday May 16 as the 100 day moving average fell below the 200 day. That means the 200 day moving average is now leading the market. This is bearish and usually signals more selling to come.
All the major moving averages are falling including the 200 day. The 21 day is still falling rapidly. It needs to turn sideways before we can expect a rally to actually move higher.
The chart is 95% bearish for Wednesday. A bearish signal this high warns investors that any bounce on Wednesday may not hold even through the day.
Stock Market Outlook review of Tue May 24 2022
Stock Market Outlook: Technical Indicators Review:
Momentum: Momentum is falling and negative.
- Settings: For momentum I use a 10 period when studying market direction.
MACD Histogram: MACD (Moving Averages Convergence / Divergence) issued a down signal Friday April 8. On Tuesday the down signal was cut to almost positive. We could see an up signal on Wednesday if there is a bounce.
- Settings: For MACD Histogram, I am using the Fast Points set at 13, Slow Points at 26 and Smoothing at 9.
Ultimate Oscillator: The Ultimate Oscillator is falling.
- Settings: The Ultimate Oscillator settings are: Period 1 is 5, Period 2 is 10, Period 3 is 15, Factor 1 is 4, Factor 2 is 2 and Factor 3 is 1. These are not the default settings but are the settings I use with the S&P 500 chart set for 1 to 3 months.
Slow Stochastic: The Slow Stochastic has a weak up signal in place and is heading out of oversold signals.
Settings: For the Slow Stochastic I use the K period of 14 and D period of 3. The Slow Stochastic tries to predict the market direction further out than just one day.
Relative Strength Index: The RSI signal is falling.
- Settings: The relative strength index is set for a period of 5 which gives it 5 days of market movement to monitor. It is often the first indicator to show an overbought or oversold signal.
Rate of Change: The rate of change signal is falling.
- Settings: Rate Of Change is set for a 21 period. This indicator looks back 21 days and compares price action from the past to the present. With the Rate Of Change, prices are rising when signals are positive. Conversely, prices are falling when signals are negative. As an advance rises the Rate Of Change signal should also rise higher, otherwise the rally is suspect. A decline should see the Rate Of Change fall into negative signals. The more negative the signals the stronger the decline.
Support and Resistance Levels To Be Aware Of:
4400 is resistance
4370 is light support
4350 is light resistance
4300 is light resistance
4290 is light resistance
4270 is light resistance
4250 is resistance
4225 is light resistance
4200 is light resistance
4150 is light resistance
4100 is light resistance
4050 is light resistance
4025 is light support
4000 was good support
3975 is light support and is a decline of 17.5%
3900 is good support and is a decline of 19%
3850 is good support and is a decline of 20%
3600 is good support at is a decline of 25%
Stock Market Outlook for Tomorrow – Wed May 25 2022
For Wed May 25 2022 the closing candlestick is advising that another bounce attempt may start. MACD is also signaling there is a chance for a higher day.
Meanwhile the rest of the technical indicators are bearish although momentum is close to turning positive which would also support the case for a bounce on Wednesday. Finally, the new home sales came out at 10:00 AM and were well below forecasts of 750,000, coming in at 591,000. This also turned the sell-off around on Tuesday. It could assist to help a rally attempt on Wednesday.
Overall the outlook is that Wednesday could see investors try again to get a bounce going, but the chance of it holding or pushing a lot higher are limited as the bearish signals remain quite strong.
If there is a rally on Tuesday I will be watching for a topping action to buy SPY puts out to Jun 10 expiry.
Potential Market Moving Events
There are a number of market moving events on Wednesday with the FOMC minutes in particular of importance at 2:00 PM. Expect big swings at 2:00 PM.
Tuesday:
10:00 New Home Sales were good at 591,000 but well below the forecast of 750,000. This could assist a bounce attempt on Wednesday.
Wednesday:
8:30 Durable Goods Orders
2:00 FOMC minutes (often moves markets)
Thursday:
8:30 Weekly Initial Unemployment Insurance Claims
10:00 Pending Home Sales
Friday:
8:30 PCE Inflation / core and year-over-year
8:30 Real Disposable Income
10:00 Consumer Sentiment Index from UofM
10:00 5 Year Inflation Expectations
Stock Market Outlook Archives
Stock Market Outlook For Wed May 6 2026 – Choppy But Higher Still

Morning Investing Strategy Notes for Tue May 5 2026

Stock Market Outlook For Tue May 5 2026 – Overbought and Lower

Morning Investing Strategy Notes for Mon May 4 2026
Stock Market Outlook For Mon May 4 2026 – Dips Likely With Possible Lower Close

Morning Investing Strategy Notes for Fri May 1 2026
Stock Market Outlook For Fri May 1 2026 – Overbought But Higher

Morning Investing Strategy Notes for Thu Apr 30 2026
Stock Market Outlook For Thu Apr 30 2026 – Dips Likely Possible Lower Close
Morning Investing Strategy Notes for Wed Apr 29 2026
Stock Market Outlook For Wed Apr 29 2026 – Choppy But Higher Ahead Of More Earnings

Morning Investing Strategy Notes for Tue Apr 28 2026