
 Prior Trading Day Summary:
Friday saw investors continue the rally despite the PCE number showing far more weakness than expected. The rally on Friday though saw lower volumes which could start the final week of April with a bit of weakness.
On Friday the SPX ended up 51 points to close at 5100. For the week the index was up 132 points. This was the first positive week for April.
The NASDAQ rose 316 points to close at 15928. For the week the index gained 645 points, the only positive week for April.
Let’s review the closing technical indicators from Fri Apr 26 2024 to see what investors should expect on Mon Apr 29 2024.
Stock Market Outlook: SPX Closing Chart For Fri Apr 26 2024
The index closed just below the 50 day moving average.
The closing candlestick is signaling bullish for Monday but with long shadows which typical advises investors there will be dips today.
The 21 day moving average is falling sharply and is ready to fall below the 50 day moving average. This will be a major down signal if it occurs, which seems likely.
The 50 day moving average is trending sideways which is bearish.
The 200 day moving average is still climbing. The 200 day is at 4747 which is bullish and the 100 day is also climbing.
The Lower Bollinger Band is turning lower and down at the 100 day moving average which is bearish.
The Upper Bollinger Band is also moving lower which is bearish.
The S&P chart is more bearish than bullish for Monday.
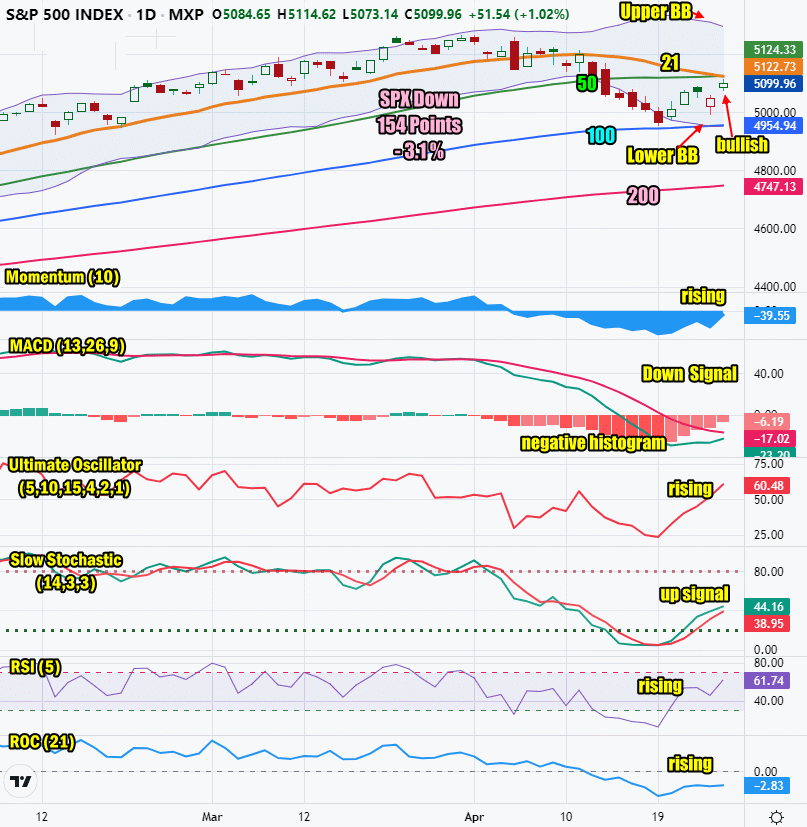
SPX Stock Market Outlook review of Fri Apr 26 2024 – chart courtesy TradingView
Stock Market Outlook: Technical Indicators Review
Momentum: Momentum is rising and negative. It is signaling higher for Monday.
|
MACD Histogram: MACD (Moving Averages Convergence / Divergence) issued a down signal on Tue Apr 2. On Fri Apr 26 2024 the down signal and histogram lost strength.
|
Ultimate Oscillator: The Ultimate Oscillator is rising. It is signaling a higher day for Monday.
|
Slow Stochastic: The Slow Stochastic has an up signal in place.
|
Relative Strength Index: The RSI signal is rising and positive.
|
Rate of Change: The rate of change signal is rising signaling a higher close for Monday.
|
Stock Market Outlook: Support and Resistance Levels |
| 5275 is resistance |
| 5250 is resistance |
| 5225 is resistance |
| 5200 is resistance |
| 5190 is resistance |
| 5175 is resistance |
| 5150 is resistance |
| 5125 is resistance |
| 5115 is resistance |
| 5100 is resistance |
| 5075 is resistance |
| 5050 is resistance |
| 5025 is support |
| 5000 is light support |
| 4990 is light support |
| 4975 is light support |
| 4950 is support |
Stock Market Outlook for Mon Apr 29 2024
Monday will see dips intraday as there is a lot of weakness in the SPX. Momentum is beginning to shift from up to neutral. The bulls have far more signals to the upside than the bears do to the downside for Monday. By Wednesday when the latest FOMC decision on interest rates is released, the bears may have more of a say.
There are no economic events on Monday which usually favors the market moving higher.
Potential Economic and Political Market Moving Events
The main events this week are the Fed’s decision on interest rates on Wednesday followed by the April employment report on Friday.
Monday:
No reports of significance. This usually favors the bulls.