
Prior Trading Day Summary
On Thu Nov 5 2026 from the very start selling erupted as investors gave back the rallies from Wednesday and pummeled tech stocks in particular. The SMH ETF VanEck Semiconductor had its worse single day since the March 2020 covid-19 collapse. The ETF lost 11.21% a historic loss. Concerns by investors over Democrat plans or “perceived” plans for stopping or stalling AI data centers throughout the country sent tech stocks plunging. As most did not see their stocks rally on Wednesday, the losses were even larger on Thursday.
The S&P closed down 335 points to end the day at 7353. I had expected a bounce around the 7500 valuation but that failed and the SPX broke down to the 200 day moving average. Volume was not overly heavy at 7.7 billion shares traded but 83% of all volume was moving lower and 84% of all stocks were falling by the close. It was the worse day for the index since “Liberation Day” in April 2025. As far as wealth destruction, it is estimated $2.9 trillion to $3 trillion in market capitalization was lost making it the largest nominal dollar loss in financial history.
The NASDAQ plunged 141 points closing at 24,315. Volume jumped to 13.6 billion with 850 new 52 week lows and 229 new highs. This is the highest number of new lows since May 12 2022. By the close 81% of all stocks were falling. While the loss of 5.52% is large there are many other days with larger percentage losses but historically it was the largest single post loss in NASDAQ history.
Let’s review the closing technical indicators from Thu Nov 5 2026 to see how Friday may end up especially with the October jobs numbers being released an hour before the open of trading.
Stock Market Outlook: SPX Closing Chart For Thu Nov 5 2026
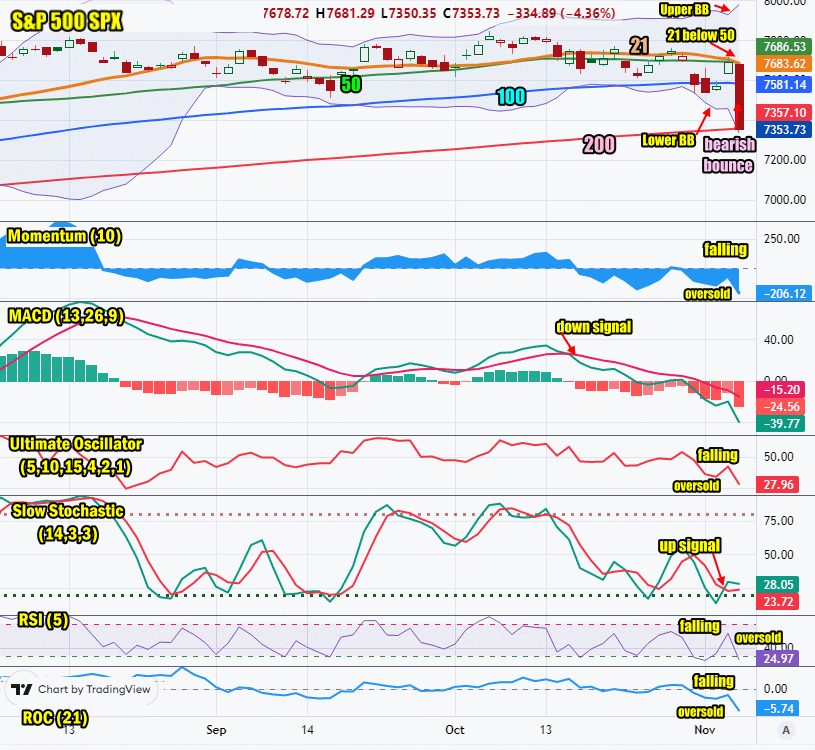
The index ended the day below the Upper Bollinger Band and the 21, 50 and 100 day moving averages. It stopped at the 200 day moving average and Lower Bollinger Band. The SPX is not down 10% at present.
The closing candlestick is indicating that Thursday saw steady and unrelenting selling. The index is oversold and a bounce is likely.
The 21 day moving average is falling and closed at 7683. It is below the 50 days moving average. This is bearish.
The 50 day moving average is falling and closed at 7686. This is bearish.
The 100 day moving average is falling and closed at 7581. This is bearish.
The 200 day moving average is unchanged and closed at 7353. This is bearish.
The Lower Bollinger Band is below the 21, 50 100 day moving averages. It is down at the 200 day. This is negative for stocks. The Upper Bollinger Band is rising which at present is bullish.
The SPX chart is strongly bearish for Fri Nov 6 2026.
SPX Stock Market Outlook review of Thu Nov 5 2026
Stock Market Outlook: Technical Indicators Review
Momentum: Momentum is falling and negative. This is bearish. Readings are at oversold levels.
|
MACD Histogram: MACD (Moving Averages Convergence / Divergence) issued a down signal on Thu Oct 15 2026. The down signal was stronger on Thu Nov 5 2026.
|
Ultimate Oscillator: The Ultimate Oscillator is falling which is bullish. It is signaling oversold.
|
Slow Stochastic: The Slow Stochastic has a weak up signal in place which is bullish. It is also at oversold readings.
|
Relative Strength Index: The RSI signal is falling and bearish. It is signaling oversold.
|
| Rate of Change: The rate of change is falling and signaling that Friday will end lower. It is at levels signaling oversold. Settings: Rate Of Change is set for a 21 period. This indicator looks back 21 days and compares price action from the past to the present. With the Rate Of Change, prices are rising when signals are positive. Conversely, prices are falling when signals are negative. As an advance rises, the Rate Of Change signal should also rise higher, otherwise the rally is suspect. A decline should see the Rate Of Change fall into negative signals. The more negative the signals the stronger the decline. |
Stock Market Outlook: Support and Resistance Levels |
| 7800 is resistance |
| 7780 is resistance |
| 7750 is resistance |
| 7700 is resistance |
| 7650 is resistance |
| 7600 is resistance |
| 7570 is resistance |
| 7550 is resistance |
| 7500 is support |
| 7400 is support |
| 7300 is support |
| 7250 is support |
Stock Market Outlook for Fri Nov 6 2026
While markets have been resilient Thursday’s drop was historic in many aspects and normally this kind of drop is not recovered quickly. The index has not been down to the 200 day moving average since March 2026. In that drop the index took 28 calendar days to recover the loss. I do not expect this recovery will be swift.
For Fri Nov 6 2026 there is a good chance the market will open flat and move lower but then attempt a bounce. The October Non-Farm Payroll Numbers will have some impact but the day will see many investors remain nervous and any bounce will quickly find sellers. The day looks unsteady with a strong possibility of another lower day especially ahead of the weekend as many investors prefer to move to the sidelines over a weekend after a market collapse.
Potential Economic and Political Market Moving Events
Monday:
9:45 Manufacturing PMI for Oct was lower than estimated, coming in at 54.9
10:00 Construction spending for Sept was much lower than estimated coming in negative at -1.5%
Tuesday:
Mid-Terms
10:00 Job openings and Labor Turnover for Sep was higher than estimated coming in at 7.5 million.
10:00 Factory orders for Sepwere much stronger than estimated, rising to 1.8%
Wednesday:
8:15 ADP National Employment report for October estimates 75,000 jobs down from 90,000 prior
8:30 Trade Balance for Sep is estimated to fall to -107.7 billion
9:45 US Services PMI for Oct is estimated almost unchanged at 58
10:00 ISM Report On Business Services PMI for Oct is estimated at 54.8 down only slightly from 54.9 prior
Thursday:
8:30 Weekly Initial Unemployment Insurance Claims were below estimates coming in at 189,000
Friday:
8:30 October non-farm payroll report is estimated to show 59,000 new jobs
8:30 Unemployment rate is estimated unchanged at 4.2%