
Summary:
Monday Apr 9 2018 saw stocks move higher from the open. They climbed throughout most of the day until mid-afternoon. After 2:00 PM with the index slightly above 2650, sellers started to pressure stocks. However the stronger pullback came when reports circulated that the FBI had conducted raids on President Trump’s lawyer’s office. That sent stocks spiraling lower and ended the day with only slight gains.
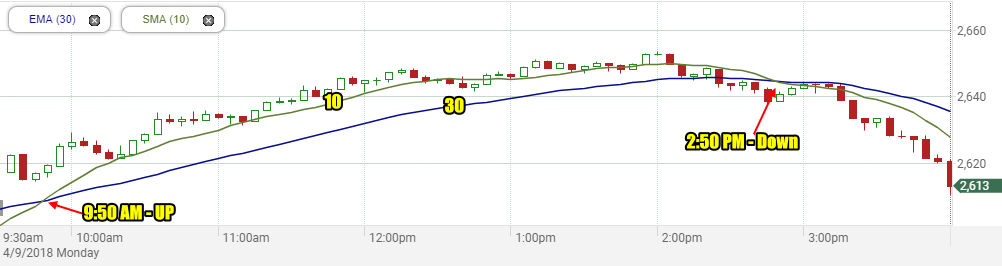
S&P 500 Intraday Apr 9 2018
Closing Statistics:
On April 9th (2018) the closing price for the S&P 500 was $2613.16. The security opened up, gained 8.69 points, rising 0.33%.
The closing price for the NASDAQ Composite was $6950.34. The security opened higher, rose 35.23 points for a gain of 0.51%.
The closing price for the Dow Jones Industrial Average was $23979.10. The index opened higher, gaining 46.34 points rising 0.19%.
Stock Market Outlook Chart Comments At The Close:
The chart overall is once again bearish.
The index rose to reach the 100 day moving average and then pulled back. The close left behind a bearish candlestick for Tuesday.
The 21 day moving average is now down at the 100 day. The 50 day moving average is still leading the market but it too is starting to drop.
All the indexes except for the 200 are falling. The Upper Bollinger Band is also now falling. The 200 day is no longer climbing which is bearish.

Stock Market Outlook review of Mon Apr 9 2018
Stock Market Outlook: Technical Indicators Review:
Momentum: For momentum I use a 10 period when studying market direction. Momentum is positive and rising.
MACD Histogram: For MACD Histogram, I am using the Fast Points set at 13, Slow Points at 26 and Smoothing at 9. MACD (Moving Averages Convergence / Divergence) issued a sell signal on March 20. That sell signal was weaker on the close.
Ultimate Oscillator: The Ultimate Oscillator settings are: Period 1 is 5, Period 2 is 10, Period 3 is 15, Factor 1 is 4, Factor 2 is 2 and Factor 3 is 1. These are not the default settings but are the settings I use with the S&P 500 chart set for 1 to 3 months. The Ultimate Oscillator signal is positive and moving sideways.
Slow Stochastic: For the Slow Stochastic I use the K period of 14 and D period of 3. The Slow Stochastic tries to predict the market direction further out than just one day. The Slow Stochastic has a down signal still in place.
Relative Strength Index: The relative strength index is set for a period of 5 which gives it 5 days of market movement to monitor. It is often the first indicator to show an overbought or oversold signal. The RSI signal is rising.
Rate of Change: Rate Of Change is set for a 21 period. This indicator looks back 21 days and compares price action from the past to the present. With the Rate Of Change, prices are rising when signals are positive. Conversely, prices are falling when signals are negative. As an advance rises the Rate Of Change signal should also rise higher, otherwise the rally is suspect. A decline should see the Rate Of Change fall into negative signals. The more negative the signals the stronger the decline. The rate of change is negative and falling.
Support Levels To Be Aware Of:
2745 to 2750 was light support
2710 was light support.
2700 was good support.
2675 was light support.
2650 was light support and 2620 was also light support.
2600 is good support.
There is good support at the 2550 level from where the market bounced back from the recent correction on Feb 9.
The S&P has light support at 2480. It also has light support at 2450 and good support at 2425. Below that there is some support at 2400, 2380, 2350. 2300 has the most support at present but would represent a full correction as a drop to this level would be 20% and just 5% away from a potential bear market signal.
Stock Market Outlook for Tomorrow – Tue Apr 10 2018
The close on Monday saw the indexes had given back the rally from Monday. However the technical indicators are not as bearish as the market and the index. The loss of the rally means Tuesday morning will be weak and may see a negative slant into the mid-morning. I am though expecting the market to pick up in the early afternoon.
We should see a very choppy day of trading on Monday and the index will be negative at times, however the close should be positive.
Stock Market Outlook Archives
Stock Market Outlook for Thu May 2 2024 – Potential Bounce But Lower

Morning Investing Strategy Notes for Wed May 1 2024

Stock Market Outlook for Wed May 1 2024 – Bounce But Lower – Fed Interest Rate Decision

Morning Investing Strategy Notes for Tue Apr 30 2024
Stock Market Outlook for Tue Apr 30 2024 – Dips Likely – Flat To Higher Close

Morning Investing Strategy Notes for Mon Apr 29 2024
Stock Market Outlook for Mon Apr 29 2024 – Some Weakness But Higher

Morning Investing Strategy Notes for Fri Apr 26 2024
Stock Market Outlook for Fri Apr 26 2024 – Higher and Positive Close

Morning Investing Strategy Notes for Thu Apr 25 2024
Stock Market Outlook for Thu Apr 25 2024 – Weakness and Lower

Morning Investing Strategy Notes for Wed Apr 24 2024
Stock Market Outlook for Wed Apr 24 2024 – Some Weakness But Higher Close

Morning Investing Strategy Notes for Tue Apr 23 2024
Stock Market Outlook for Tue Apr 23 2024 – Bounce But Lower