

Prior Trading Day Summary
On Wed Sep 30 2026 stocks tried to a positive close to end the month o September but only the NASDAQ managed to end in the green. The S&P sold lower in the final half hour of the day to close down 19 points and end at 7651. This continues to see the SPX trading more sideways than up or down. Volume rose to 5.8 billion but new lows rose by 103 stocks. By the close there were still 300 new lows. 61% of stocks were falling by the close but underneath those numbers are some positive signals to start October.
The NASDAQ ended the day higher, up 63 points to 26,861 on 9.2 billion shares traded. By the close 58% of stocks were still falling but many investors were focused on earnings for Micron Technology and not following much of the broader NASDAQ.
The close for the SPX was a bit negative and as you can see in the technical indicators below, there is a new down signal to contend with.
Let’s review the SPX closing technical indicators from Wed Sep 30 2026 to see what they predict for Thu Oct 1 2026.
Stock Market Outlook: SPX Closing Chart For Wed Sep 30 2026
The index ended the day below the Upper Bollinger Band and the 21 day moving average. This is bearish.
The closing candlestick is bearish but also has a long shadow which often signals a bounce is at hand.
The 21 day moving average is falling and closed at 7669. This is bearish.
The 50 day moving average is rising and closed at 7648. This is bullish.
The 100 day moving average is rising and closed at 7509. This is bullish.
The 200 day moving average is rising and closed at 7249. This is bullish.
The Lower Bollinger Band is above the 100 day moving average and falling which is bullish. The Upper Bollinger Band is falling which is bearish.
The SPX chart is more bearish that bullish for Thu Oct 1 2026 but is also signaling a strong chance of a bounce today.
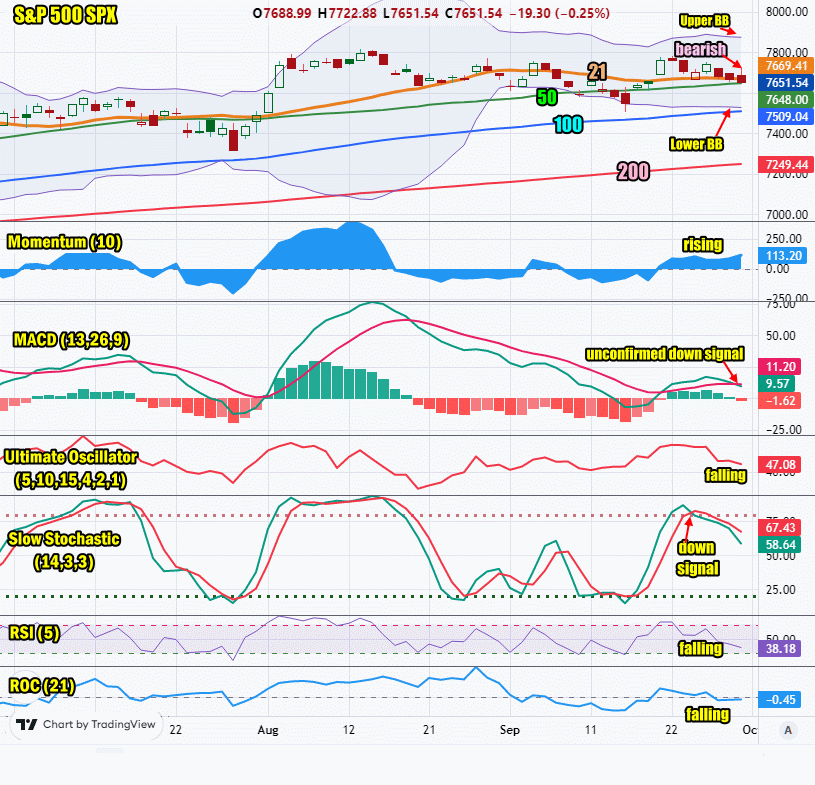
SPX Stock Market Outlook review of Wed Sep 30 2026
Stock Market Outlook: Technical Indicators Review
Momentum: Momentum is rising and positive. This is bullish.
|
MACD Histogram: MACD (Moving Averages Convergence / Divergence) issued an up signal on Mon Sep 21 2026. The up signal was gone on Wed Sep 30 2026, replaced by a new down signal which is not yet confirmed.
|
Ultimate Oscillator: The Ultimate Oscillator is falling. This is bearish.
|
Slow Stochastic: The Slow Stochastic has a down signal in place and is bearish.
|
Relative Strength Index: The RSI signal is falling. This is bearish.
|
| Rate of Change: The rate of change is falling, signaling that Thursday will end lower. Settings: Rate Of Change is set for a 21 period. This indicator looks back 21 days and compares price action from the past to the present. With the Rate Of Change, prices are rising when signals are positive. Conversely, prices are falling when signals are negative. As an advance rises, the Rate Of Change signal should also rise higher, otherwise the rally is suspect. A decline should see the Rate Of Change fall into negative signals. The more negative the signals the stronger the decline. |
Stock Market Outlook: Support and Resistance Levels |
| 7800 is resistance |
| 7780 is resistance |
| 7750 is resistance |
| 7700 is resistance |
| 7650 is resistance |
| 7600 is resistance |
| 7590 is resistance |
| 7570 is resistance |
| 7550 is resistance |
| 7500 is support |
| 7450 is support |
| 7425 is support |
| 7400 is support |
Stock Market Outlook for Thu Oct 1 2026
Micron Technology (MU) earnings were astonishing as they roared beyond all estimates and easily beat last year’s same quarter numbers. The outlook jumped 11 fold. After hours the stock had a seesaw couple of hours but today the stock should shoot higher. With earnings showing no chance of a slowdown yet in chip demand, Micron stock will be heading higher and on Thursday should drag the market with it. Also on Thursday many investors will be preparing for the September Non-Farm Payroll Numbers due out at 8:30 on Friday morning. I will be putting together a trade this morning, to try to profit from any swing in the SPX after the numbers are released.
On Wednesday inflation numbers were far weaker than estimated and gave many investors a reason to rethink any October rate hike. Indeed if the next inflation numbers continue to show weakness, we might see no rate hike in November as well. With the mid-terms in November, a rate hike before then would be highly unlikely. Indeed the inflation numbers for August released on Wednesday might give pause to the Fed officials who voted overwhelmingly for a rate increase in September.
For Thu Oct 1 2026 the technical indicators are bearish and we have a new but unconfirmed down signal from the MACD technical indicator. However we have amazing earnings from Micron Technology which should boost all chip stocks today. A bounce is likely.
Potential Economic and Political Market Moving Events
Monday:
No reports
Tuesday:
10:00 Conference Board Consumer confidence for Sep fell far more than estimated coming in at 81.9 versus 89 estimated
10:00 Job openings and Labor Turnover Survey for Aug was lower than estimated, coming in at 7.1 million
Wednesday:
8:15 ADP National Employment Report for Sep was way above estimated at 90,000
8:30 AM 3rd estimate GDP for the second quarterwas also well above estimates at 2.2%
8:30 Personal Income, month over month for August was below estimates at 0.2%
8:30 Consumer Spending for August was well above estimates coming in at 0.9%
8:30 PCE Price Iindex month over month for August came in as estimated at 0.3%
8:30 PCE Price Index year-over-year for August was lower than estimated coming in at 3.4%
8:30 PCE Core Price IIndex month over month for August was weaker than estimated, coming in at 0.2%
8:30 PCE Core Price Index year-over-year for August was well below estimates at 3%
Thursday:
8:30 Weekly Initial Unemployment Insurance Claims for Sep 26 are estimated at 200,000, up from the prior week’s 197,000
9:45 Manufacturing ISM for Sept is estimated to rise to 57 from 53.9 prior
10:00 Construction spending for August is expected to rise to 0.1% from -0.5% prior
Friday:
8:30 Sept Non-Farm Payroll Numbers are estimated at 84,000 down from 162,000 prior
8:30 Unemployment rate is estimated unchanged at 4.1%
8:30 Average hour earnings month over month are estimated to remain unchanged at 0.3%
8:30 Average hourly earnings year-over-year are estimated to rise to 3.2% from 3.1% prior