

FullyInformed.com
Generic filters

Stock Market Outlook For Tue Sep 29 2026 – Some Weakness Possible With Lower Day But Still Bullish

Sep 29, 2026 | Stock Market Outlook

SPX Stock Market Outlook review of Wed May 8 2024 – chart courtesy TradingView


Prior Trading Day Summary

On Mon Sep 28 2026 stocks struggled with higher bond yields and stubbornly high oil prices.

The SPX ended the day down 59 points to 7683. Volume was 5.3 billion, higher than Friday’s 4.6 billion. The number of new 52 week highs was just 17 while new lows continued to move higher with 446 by the end of the day. This is bearish. 74% of the SPX stocks were falling by the close. All of this is bearish.

The NASDAQ fell 248 points on 7.4 billion shares traded. The index closed at 26,820 with 69% of all stocks falling by the close. New highs were 55 but new 52 week lows rose to 532. These are ery bearish numbers.

Let’s review the SPX closing technical indicators from Mon Sep 28 2026 to see what they predict for Tue Sep 29 2026.

Prior Trading Day Earned Income

Last week I showed income being earned through the various strategies and portfolios in use on FullyInformed to show investors what is possible for investors. The daily income is now being moved to the members site. Income and amounts being earned will randomly be shown at times on the public website. To see all trades and daily income being earned, consider becoming a member.


Stock Market Outlook: SPX Closing Chart For Mon Sep 28 2026 

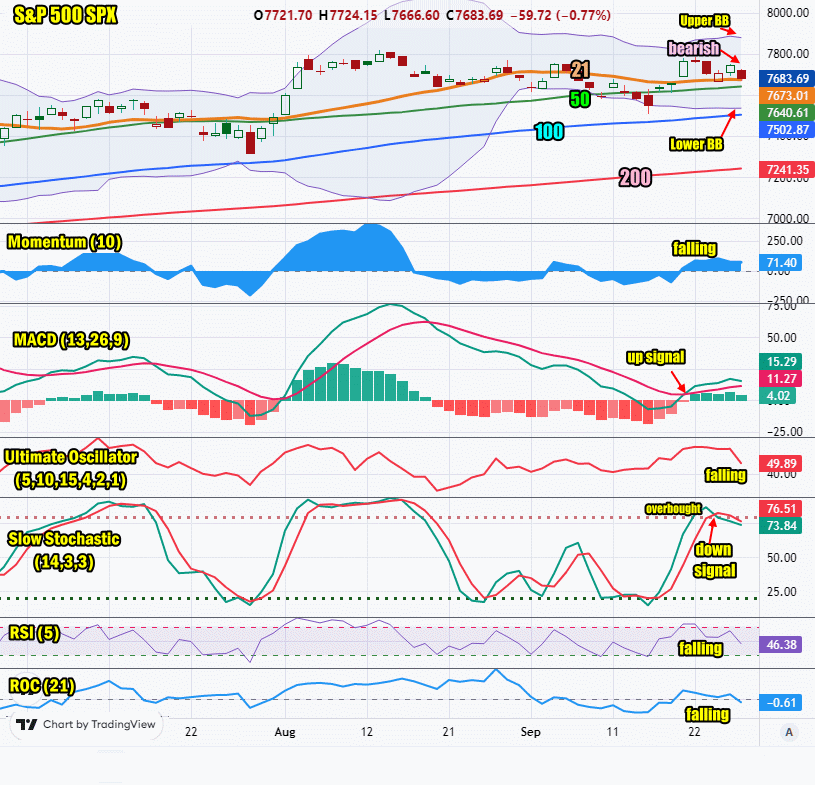
The index ended the day below the Upper Bollinger Band and back at the 21 day moving average. This is bearish.

The closing candlestick is bearish for today.

The 21 day moving average is falling and closed at 7673. This is bearish.

The 50 day moving average is rising and closed at 7640. This is bullish.

The 100 day moving average is rising and closed at 7502. This is bullish.

The 200 day moving average is rising and closed at 7241. This is bullish.

The Lower Bollinger Band is above the 100 day moving average and falling which is bullish. The Upper Bollinger Band is falling which is bearish.

The SPX chart is more bearish that bullish for Tue Sep 29 2026.
SPX Stock Market Outlook review of Mon Sep 28 2026


Stock Market Outlook: Technical Indicators Review

Momentum: Momentum is falling and positive. This is bullish.

  • Settings: For momentum I use a 10 period when studying market direction.
MACD Histogram: MACD (Moving Averages Convergence / Divergence) issued an up signal on Mon Sep 21 2026. The up signal was weaker on Mon Sep 28 2026.

  • Settings: For MACD Histogram, I am using the Fast Points set at 13, Slow Points at 26 and Smoothing at 9.
Ultimate Oscillator: The Ultimate Oscillator is falling sharply. This is bearish.

  • Settings: The Ultimate Oscillator settings are: Period 1 is 5, Period 2 is 10, Period 3 is 15, Factor 1 is 4, Factor 2 is 2 and Factor 3 is 1. These are not the default settings but are the settings I use with the S&P 500 chart set for 1 to 3 months.
Slow Stochastic: The Slow Stochastic has a down signal in place and is bearish. It is overbought.

  • Settings: For the Slow Stochastic I use the K period of 14 and D period of 3. The Slow Stochastic tries to predict the market direction further out than just one day.
Relative Strength Index: The RSI signal is falling. This is bearish.

  • Settings: The relative strength index is set for a period of 5 which gives it 5 days of market movement to monitor. It is often the first indicator to show an overbought or oversold signal.
Rate of Change: The rate of change is falling, signaling that Tuesday will end lower.

Settings: Rate Of Change is set for a 21 period. This indicator looks back 21 days and compares price action from the past to the present. With the Rate Of Change, prices are rising when signals are positive. Conversely, prices are falling when signals are negative. As an advance rises, the Rate Of Change signal should also rise higher, otherwise the rally is suspect. A decline should see the Rate Of Change fall into negative signals. The more negative the signals the stronger the decline.


Stock Market Outlook: Support and Resistance Levels

7800 is resistance
7780 is resistance
7750 is resistance
7700 is resistance
7650 is resistance
7600 is resistance
7590 is resistance
7570 is resistance
7550 is resistance
7500 is support
7450 is support
7425 is support
7400 is support


Stock Market Outlook for Tue Sep 29 2026 

For Tue Sep 29 2026 the SPX is moving lower but if you look at the SPX chart above you can see that it is actually moving in a sideways pattern. Analysts always find this type of market perplexing and frustrating. They are looking for a clear direction and without one, most analysts remain bearish. But if the SPX were going to fall apart, it should have happened already. Today we will see the SPX slip below the 21 day but then try to recover it. Overall the intraday outlook is bearish and there is a good chance for a lower close but overall the outlook remains bullish.  On Wednesday we get the latest inflation read with PCE reports (Personal Consumption Expenditures). After the close on Wednesday we also get the latest quarterly earnings from Micron Technology (MU). Today we could see stocks trade on low volume with not much change ahead of those reports tomorrow.


Potential Economic and Political Market Moving Events

Monday:

No reports

Tuesday:

10:00 Conference Board Consumer confidence for Sep is estimated to slip only slightly to 89 from 89.4 prior

10:00 Job openings and Labor Turnover Survey for Aug is estimated to fall to 7.2 million from 7.3 million prior


Recent Outlooks

Morning Investing Strategy Notes for Mon Sep 28 2026

For FullyInformed Members the morning Investing Strategy Notes for Mon Sep 28 2026 views the start of the final week of September. Equities discussed today include XOP ETF, SPY ETF, TQQQ ETF and more. The morning Investing Strategy Notes are …

Stock Market Outlook For Mon Sep 28 2026 – Weakness With Dips Likely

Prior Trading Day Summary On Fri Sep 25 2026 stocks rose with the SPX rising 39 points to close at 7743 and the NASDAQ rising 129 points to end the week at 27,068. For the week the S&P was up …

Morning Investing Strategy Notes for Fri Sep 25 2026

For FullyInformed Members the morning Investing Strategy Notes for Fri Sep 25 2026 reviews the chance of a higher close for the last day of the week. Equities discussed today include NVIDIA Stock (NVDA), Apple Stock (AAPL), Costco Stock (COST) …

Stock Market Outlook For Fri Sep 25 2026 – More Weakness With Chance Of A Bounce

Prior Trading Day Summary On Thu Sep 24 2026 stocks had a wild day as the SPX index fell to 7662 and rose to 7719 before closing almost unchanged at 7704. Volume rose 200 million shares to 5.4 billion. There …

Morning Investing Strategy Notes for Thu Sep 24 2026

For FullyInformed Members the morning Investing Strategy Notes for Thu Sep 24 2026 reviews the chance of further selling today. Equities discussed today include McDonalds Stock (MCD), IWM ETF, Microsoft Stock (MSFT) and more. The morning Investing Strategy Notes are …

Stock Market Outlook For Thu Sep 24 2026 – Dips Likely – Lower Close

Prior Trading Day Summary On Wed Sep 23 2026 stocks gave back some of their recent gains as Treasury Yields rose on the back of climbing oil prices. 30 year yields were at their highest level since 2004. As well …

Morning Investing Strategy Notes for Wed Sep 23 2026

For FullyInformed Members the morning Investing Strategy Notes for Wed Sep 23 2026 reviews Tuesday’s flat close. Equities discussed today include Home Depot Stock (HD), Lowes Stock (LOW), JP Morgan Chase Stock (JPM) and more. The morning Investing Strategy Notes …

Stock Market Outlook For Wed Sep 23 2026 – MACD Up Signal Confirmed

Prior Trading Day Summary On Tue Sep 22 2026 the NASDAQ made a new all-time high on strong volume. The SPX ended the day flat. Despite this the MACD technical up signal from Monday was confirmed today. The SPX ended …

Morning Investing Strategy Notes for Tue Sep 22 2026

For FullyInformed Members the morning Investing Strategy Notes for Tue Sep 22 2026 reviews Monday’s huge rally to determine the likelihood of it continuing. Equities discussed today include Advanced Micro Devices Stock (AMD), Intel Stock (INTC), Meta Stock (META), SPXL …

Stock Market Outlook For Tue Sep 22 2026 – Unconfirmed MACD Up Signal – Bullish

Prior Trading Day Summary On Mon Sep 21 2026 with bond yields dipping and oil falling below $100 investors rushed into stocks and gave the SPX its biggest one day rally since August 4 defying the bears and the many …

Morning Investing Strategy Notes for Mon Sep 21 2026

For FullyInformed Members the morning Investing Strategy Notes for Mon Sep 21 2026 discuss the start of the fourth week of September. Equities discussed today include Apple Stock (AAPL), Best Buy Stock (BBY) and more. The morning Investing Strategy Notes …

Stock Market Outlook For Mon Sep 21 2026 – Choppy With Dips But Higher Close

Prior Trading Day Summary On Fri Sep 18 2026 stocks saw pressure mounting again as bond yields rose. Tech stocks, in particular semiconductor stocks rose to offset general losses throughout the indexes. The SPX end the day up 12 points …

Morning Investing Strategy Notes for Fri Sep 18 2026

For FullyInformed Members the morning Investing Strategy Notes for Fri Sep 18 2026 discuss the chance Thursday’s rally can continue Friday. Equities discussed today include SPY ETF, Lennar Corp Stock (LEN), Dell Technologies Stock (DELL), Moderna Stock (MRNA) and more …

Stock Market Outlook For Fri Sep 18 2026 – Choppy – Dips Likely But Higher Close

Prior Trading Day Summary On Thu Sep 17 2026 stocks saw the bounce investors were waiting for. Everything lined up for the rally with oil prices dipping and bond yields also sliding lower after yesterday’s interest rate hike by the …

Subscribe For The Latest News