

Prior Trading Day Summary
On Thu Sep 24 2026 stocks had a wild day as the SPX index fell to 7662 and rose to 7719 before closing almost unchanged at 7704. Volume rose 200 million shares to 5.4 billion. There were 436 new 52 week lows which is the highest number of new lows since April 2025. For the week though the SPX is hanging on to a 53 point gain.
The NASDAQ bucked the downtrend and rose 3 points to close at 26,939. Volume fell 600 million shares to 8.3 billion and the number of new 52 week lows rose to 479 but the index is holding onto a 416 point gain for the week with just one day left.
Let’s review the SPX closing technical indicators from Thu Sep 24 2026 to see what they predict for Fri Sep 25 2026 and whether the indexes try for a bounce.
Prior Trading Day Earned Income
On Thu Sep 24 2026 there were 8 trades with a total income earned of $4305.
Among the trades done on Thursday were two trades posted late in the day. The first was in Valero Energy Stock (VLO) which has brought a lot of profits to my portfolio this year and a second trade was done in GE Aerospace Stock (GE) which is in a downtrend. Members can review all of today’s trades through this list. Reviewing prior trades can be helpful and profitable as prices change constantly and often improve in the day(s) following trades being entered.
Current Week:
On Wed Sep 23 2026 there were 9 trades with a total income earned of $4175.
On Tue Sep 22 2026 there were 7 trades with a total income earned of $4064.
On Mon Sep 21 2026 there were 9 trades with a total income earned of $6056.
Stock Market Outlook: SPX Closing Chart For Thu Sep 24 2026
The index ended the day below the Upper Bollinger Band and still managed to close above all major moving averages. This is bullish as the index tested the 21 day moving average on Thursday and managed to move back above it by the close.
The closing candlestick is bearish and signals Friday will close lower.
The 21 day moving average is rising and closed at 7672. This is bullish.
The 50 day moving average is rising and closed at 7631. This is bullish.
The 100 day moving average is rising and closed at 7494. This is bullish.
The 200 day moving average is rising and closed at 7232. This is bullish.
The Lower Bollinger Band is above the 100 day moving average and falling which is bullish. The Upper Bollinger Band is turning sideways which neutral.
The SPX chart is more bullish than bearish for Fri Sep 25 2026 despite the selling over the past three days.
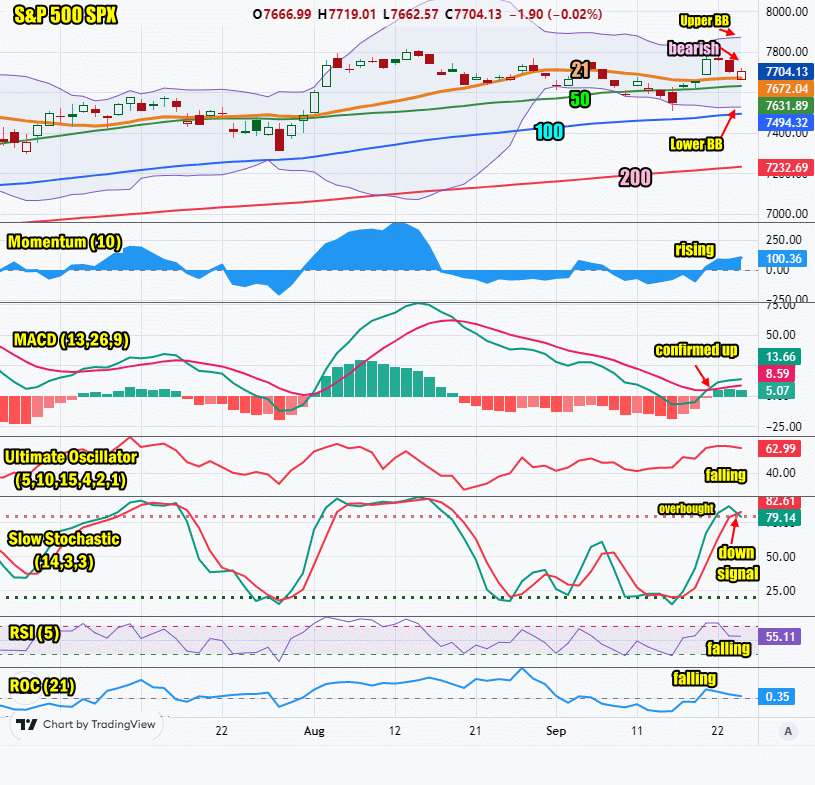
SPX Stock Market Outlook review of Thu Sep 24 2026
Stock Market Outlook: Technical Indicators Review
Momentum: Momentum is rising and positive. This is bullish.
|
MACD Histogram: MACD (Moving Averages Convergence / Divergence) issued an up signal on Mon Sep 21 2026. The up signal was weaker on Thu Sep 24 2026.
|
Ultimate Oscillator: The Ultimate Oscillator is falling and bearish.
|
Slow Stochastic: The Slow Stochastic has a down signal in place and is bearish. It is overbought.
|
Relative Strength Index: The RSI signal is falling. This is bearish.
|
| Rate of Change: The rate of change is falling, signaling that Friday will end lower. Settings: Rate Of Change is set for a 21 period. This indicator looks back 21 days and compares price action from the past to the present. With the Rate Of Change, prices are rising when signals are positive. Conversely, prices are falling when signals are negative. As an advance rises, the Rate Of Change signal should also rise higher, otherwise the rally is suspect. A decline should see the Rate Of Change fall into negative signals. The more negative the signals the stronger the decline. |
Stock Market Outlook: Support and Resistance Levels |
| 7800 is resistance |
| 7780 is resistance |
| 7750 is resistance |
| 7700 is resistance |
| 7650 is resistance |
| 7600 is resistance |
| 7590 is resistance |
| 7570 is resistance |
| 7550 is resistance |
| 7500 is support |
| 7450 is support |
| 7425 is support |
| 7400 is support |
Stock Market Outlook for Fri Sep 25 2026
For Fri Sep 25 2026 the technical indicators are biased to the downside with almost all the technical indicators pointing lower. Even the MACD up signal lost strength on Thursday. However that said, the indexes are holding their ground which often signals a bounce coming to end the week.
Potential Economic and Political Market Moving Events
Monday:
No reports
Tuesday:
No reports
Wednesday:
9:45 US Flash Manufacturing PMI for Sep was much higher than estimated coming in at 57
9:45 US Flash Services PMI was also higher than estimated coming in at 58.7
Thursday:
8:30 Weekly Initial Unemployment Insurance Claims for Sep 19 were lower than estimated at 197,000
10:00 New home sales for August were far above estimates, coming in at 684,000 versus 618,000 estimated.
Friday:
8:30 Durable Goods for Aug are estimated to fall to -0.3% from 1.1% prior