

Prior Trading Day Summary
On Tue Sep 29 2026 stocks struggled for a second day with higher Treasury yields and ongoing concerns about oil prices. But the close saw most of the intraday losses recovered which is bullish.
The SPX ended the day down 13 points to 7670. Volume was 5.2 billion with just 19 new 52 week highs but 403 new lows which is bearish.
The NASDAQ fell 22 points on 7.5 billion shares traded. The index closed at 26,797 with 57% of all stocks falling by the close. New highs were 58 but new 52 week lows were 483. These are still bearish numbers.
Let’s review the SPX closing technical indicators from Tue Sep 29 2026 to see what they predict for Wed Sep 30 2026.
Stock Market Outlook: SPX Closing Chart For Tue Sep 29 2026
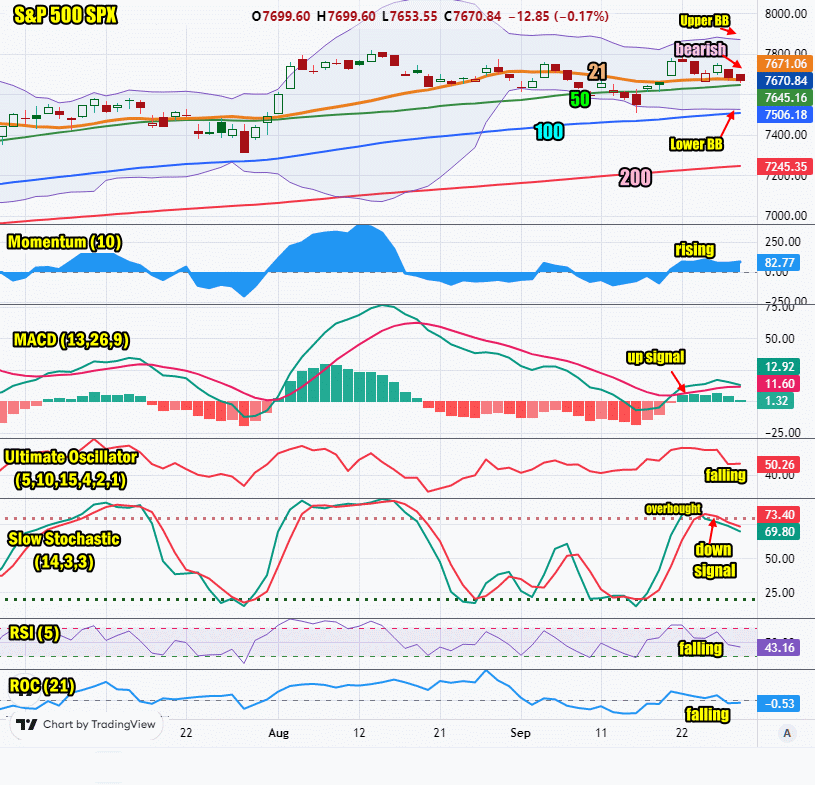
The index ended the day below the Upper Bollinger Band and back at the 21 day moving average. This is bearish.
The closing candlestick is bearish for today.
The 21 day moving average is falling and closed at 7671. This is bearish.
The 50 day moving average is rising and closed at 7645. This is bullish.
The 100 day moving average is rising and closed at 7506. This is bullish.
The 200 day moving average is rising and closed at 7245. This is bullish.
The Lower Bollinger Band is above the 100 day moving average and falling which is bullish. The Upper Bollinger Band is falling which is bearish.
The SPX chart is more bearish that bullish for Wed Sep 30 2026..
SPX Stock Market Outlook review of Tue Sep 29 2026
Stock Market Outlook: Technical Indicators Review
Momentum: Momentum is rising and positive. This is bullish.
|
MACD Histogram: MACD (Moving Averages Convergence / Divergence) issued an up signal on Mon Sep 21 2026. The up signal was weaker on Tue Sep 29 2026 and almost gone.
|
Ultimate Oscillator: The Ultimate Oscillator is falling. This is bearish.
|
Slow Stochastic: The Slow Stochastic has a down signal in place and is bearish.
|
Relative Strength Index: The RSI signal is falling. This is bearish.
|
| Rate of Change: The rate of change is falling, signaling that Wednesday will end lower. Settings: Rate Of Change is set for a 21 period. This indicator looks back 21 days and compares price action from the past to the present. With the Rate Of Change, prices are rising when signals are positive. Conversely, prices are falling when signals are negative. As an advance rises, the Rate Of Change signal should also rise higher, otherwise the rally is suspect. A decline should see the Rate Of Change fall into negative signals. The more negative the signals the stronger the decline. |
Stock Market Outlook: Support and Resistance Levels |
| 7800 is resistance |
| 7780 is resistance |
| 7750 is resistance |
| 7700 is resistance |
| 7650 is resistance |
| 7600 is resistance |
| 7590 is resistance |
| 7570 is resistance |
| 7550 is resistance |
| 7500 is support |
| 7450 is support |
| 7425 is support |
| 7400 is support |
Stock Market Outlook for Wed Sep 30 2026
The rally back from Tuesday’s lows to end the day with only slight losses is a bullish sign for stocks. Today will be all about earnings after hours from Micron Technology (MU) and the latest read on inflation which could impact stocks intraday. I will be placing a trade today in Micron stock to try to profit from any move up or down after earnings are released.
For Wednesday the outlook is sideways with dips likely but a slightly higher close ahead of the Micron earnings is likely. Watch the inflation readings due out at 8:30. Any surprises of strength could see stocks open lower on the day as investors continue to worry about further interest rate hikes from the Fed. Higher inflation on Wednesday could kill any chance of a bounce today.
Potential Economic and Political Market Moving Events
Monday:
No reports
Tuesday:
10:00 Conference Board Consumer confidence for Sep fell far more than estimated coming in at 81.9 versus 89 estimated
10:00 Job openings and Labor Turnover Survey for Aug was lower than estimated, coming in at 7.1 million
Wednesday:
8:15 ADP National Employment Report for Sep is estimated at 68,000, up from 38,000 prior
8:30 AM 3rd estimate GDP for the second quarter is estimated unchanged at 1.5%
8:30 Personal Income, month over month for August is estimated unchanged at 0.4%
8:30 Consumer Spending for August is estimated at 0.8% versus 0.2% prior
8:30 PCE Price Iindex month over month for August is estimated at 0.3% versus 0.2% prior
8:30 PCE Price Index year-over-year for August is estimated unchanged at 3.7%
8:30 PCE Core Price IIndex month over month for August is estimated at 0.3% versus 0.2% prior
8:30 PCE Core Price Index year-over-year for August is estimated unchanged at 3.3%