

Summary:
Wednesday saw stocks try to stage a rally off the Fed report at 2:00 PM. It was sharp and short with investors deciding after pushing the index higher, to sell it back lower. The close saw all 3 indexes lower although off their lows for the day.
Closing Statistics from Wed May 2 2018
The S&P fell 19.13 to 2635.67 down 0.72%
The NASDAQ Composite fell 29.81 points to 7100.90 for a drop of 0.42%
The Dow Jones Industrial Average fell 174.07 points closing at 23,924.98 for a loss of 0.72%.
Of the three indexes the NASDAQ was by far the strongest.
Stock Market Outlook Chart Comments At The Close on Wed May 2 2018
The S&P slipped lower on Wednesday, closing below all the major moving averages except for the 200 day. It left behind a bearish candlestick for Thursday.
The 50 day moving average is still leading the market but it is continuing to fall toward the 100 day. The 100 day is trending sideways but the 21 day is turning back up. Meanwhile the 200 day moving average is still climbing, which is about the only bullish signal on the map at present.

Stock Market Outlook review of Wed May 2 2018
Stock Market Outlook: Technical Indicators Review:
Momentum: For momentum I use a 10 period when studying market direction. Momentum is negative and falling.
MACD Histogram: For MACD Histogram, I am using the Fast Points set at 13, Slow Points at 26 and Smoothing at 9. MACD (Moving Averages Convergence / Divergence) issued a buy signal on Apr 11. Today, Wed May 2 2018 a new sell signal emerged by the close of the day. It still has to be confirmed by the markets on Thursday.
Ultimate Oscillator: The Ultimate Oscillator settings are: Period 1 is 5, Period 2 is 10, Period 3 is 15, Factor 1 is 4, Factor 2 is 2 and Factor 3 is 1. These are not the default settings but are the settings I use with the S&P 500 chart set for 1 to 3 months. The Ultimate Oscillator signal is negative and falling.
Slow Stochastic: For the Slow Stochastic I use the K period of 14 and D period of 3. The Slow Stochastic tries to predict the market direction further out than just one day. The Slow Stochastic signal is down for Thursday.
Relative Strength Index: The relative strength index is set for a period of 5 which gives it 5 days of market movement to monitor. It is often the first indicator to show an overbought or oversold signal. The RSI signal is falling.
Rate of Change: Rate Of Change is set for a 21 period. This indicator looks back 21 days and compares price action from the past to the present. With the Rate Of Change, prices are rising when signals are positive. Conversely, prices are falling when signals are negative. As an advance rises the Rate Of Change signal should also rise higher, otherwise the rally is suspect. A decline should see the Rate Of Change fall into negative signals. The more negative the signals the stronger the decline. The rate of change signal is also falling.
Support Levels To Be Aware Of:
2745 to 2750 was light support
2710 was light support.
2700 is support.
2675 is light support.
2650 is light support and 2620 is also light support.
2600 is good support.
There is good support at the 2550 level from where the market bounced back from the recent correction on Feb 9.
The S&P has light support at 2480. It also has light support at 2450 and good support at 2425. Below that there is some support at 2400, 2380, 2350. 2300 has the most support at present but would represent a full correction as a drop to this level would be 20% and just 5% away from a potential bear market signal.
Stock Market Outlook for Tomorrow – Thu May 3 2018
For Thu May 3 2018 the technical indicators are decidedly bearish. There are no technical signals advising that the market will climb. Instead all the signals have turned down.
Thursday will be choppy but the bias is lower for stocks.
Stock Market Outlook Archives
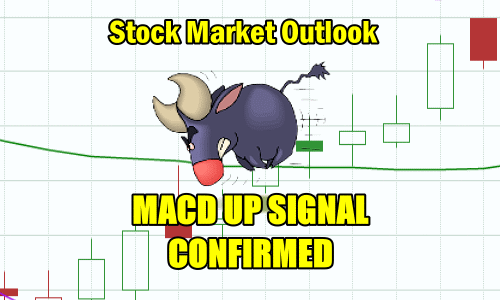
Stock Market Outlook for Tue May 7 2024 – MACD Up Signal Confirmed
Morning Investing Strategy Notes for Mon May 6 2024

Stock Market Outlook for Mon May 6 2024 – Unconfirmed MACD Up Signal

Morning Investing Strategy Notes for Fri May 3 2024
Stock Market Outlook for Fri May 3 2024 – All About The April Non-Farm Payroll Report

Morning Investing Strategy Notes for Thu May 2 2024
Stock Market Outlook for Thu May 2 2024 – Potential Bounce But Lower

Morning Investing Strategy Notes for Wed May 1 2024
Stock Market Outlook for Wed May 1 2024 – Bounce But Lower – Fed Interest Rate Decision

Morning Investing Strategy Notes for Tue Apr 30 2024
Stock Market Outlook for Tue Apr 30 2024 – Dips Likely – Flat To Higher Close

Morning Investing Strategy Notes for Mon Apr 29 2024
Stock Market Outlook for Mon Apr 29 2024 – Some Weakness But Higher

Morning Investing Strategy Notes for Fri Apr 26 2024
Stock Market Outlook for Fri Apr 26 2024 – Higher and Positive Close
