
 Prior Trading Day Summary:
On Friday the jobs report came in weaker than expected. With investors believing this could bring some relief to interest rates for the Fed, investors poured back into stocks.
The S&P gained 63 points to close at 5127. For the week, the S&P closed positive, rising 27 points. This is the second straight week of gains.
The NASDAQ rose 315 points to end the day at 16,156. For the week the index add 228 points marking a second straight week of positive returns.
The end of the day saw a new but unconfirmed up signal from the Moving Average Convergence / Divergence (MACD) technical indicator.
Let’s review the closing technical indicators from Fri May 3 2024 to see what investors should expect on Mon May 6 2024.
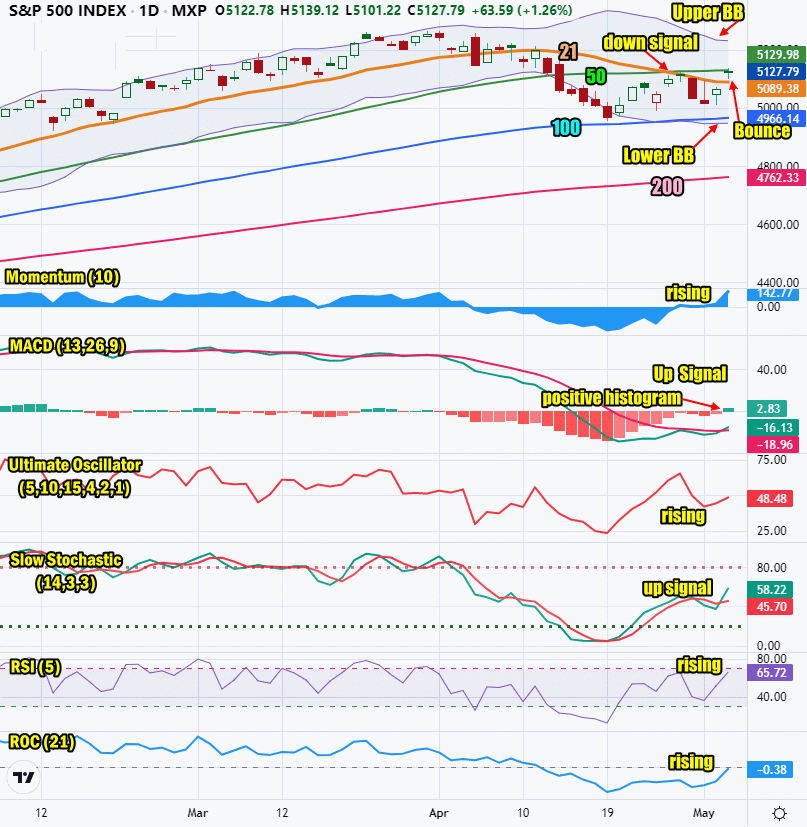
Stock Market Outlook: SPX Closing Chart For Fri May 3 2024
The index closed above the 21 day moving average but blow the 50 day. This is still bearish.
The closing candlestick is signaling that Friday was a technical bounce and Monday will see some dips but a potential higher close.
The 21 day moving average is below the 50 day moving average for a down signal.
The 50 day moving average is moving lower which is bearish.
The 200 day moving average is still climbing. The 200 day is at 4762 which is bullish and the 100 day is also climbing.
The Lower Bollinger Band is below the 100 day moving average and the Upper Bollinger Band is falling sharply. Both are bearish signals.
The S&P chart is overwhelming bearish for Monday but the closing candlestick on Friday signaled a chance for a higher close on Monday.
SPX Stock Market Outlook review of Fri May 3 2024 – chart courtesy TradingView
Stock Market Outlook: Technical Indicators Review
Momentum: Momentum is rising and positive.
|
MACD Histogram: MACD (Moving Averages Convergence / Divergence) issued a down signal on Tue Apr 2. On Fri May 3 2024 a new unconfirmed up signal was generated. The histogram also turned positive.
|
Ultimate Oscillator: The Ultimate Oscillator is rising.
|
Slow Stochastic: The Slow Stochastic has an up signal in place.
|
Relative Strength Index: The RSI signal is rising and positive.
|
Rate of Change: The rate of change signal is rising for a third day indicating a higher day is expected on Monday.
|
Stock Market Outlook: Support and Resistance Levels |
| 5275 is resistance |
| 5250 is resistance |
| 5225 is resistance |
| 5200 is resistance |
| 5190 is resistance |
| 5175 is resistance |
| 5150 is resistance |
| 5125 is resistance |
| 5115 is resistance |
| 5100 is resistance |
| 5075 is resistance |
| 5050 is support |
| 5025 is support |
| 5000 is light support |
| 4990 is light support |
| 4975 is light support |
| 4950 is support |
Stock Market Outlook for Mon May 6 2024
For Monday the closing candlestick on Friday signaled that dips were probable but there was a good chance for a higher close.
The MACD technical indicator issued an unconfirmed up signal at the close on Friday. The Slow Stochastic also issued a new up signal.
The outlook has shifted back to positive. Dips on Monday are opportunities to setup more trades. The day will end higher.
There are not many major economic reports this week. Normally this is bullish for investors.
Potential Economic and Political Market Moving Events
The main event this week is on Friday when the consumer sentiment is released.
Monday:
Two Fed Presidents speak. One at 12:50 and a second at 1:00 PM. Their comments are not expected to impact stocks.