

Prior Trading Day Summary
On Tue Aug 4 2026 the rally took a breather but the Dow Jones and NASDAQ both made interim new all-time highs. The S&P was 7 points intraday from reaching 7800.
The SPX slipped 13 points to close at 7723. Volume was 5.7 billion shares traded with 40% of all stocks rising by the close as investors decided to take profits in the afternoon on Wednesday.
The NASDAQ fell 221 points ending the day at 26,363. Volume was good at 9.5 billion. 41% of all stocks were higher by the close. Investors were taking profits Wednesday afternoon.
A pause in the rally is not a concern at present. Stocks are very overbought and profit-taking is common.
Let’s look at the closing technical indicators from Wed Aug 5 2026 to see if stocks will move higher on Thursday ahead of July’s Non-Farm Payroll Numbers due out on Friday before the open.
Stock Market Outlook: SPX Closing Chart For Wed Aug 5 2026
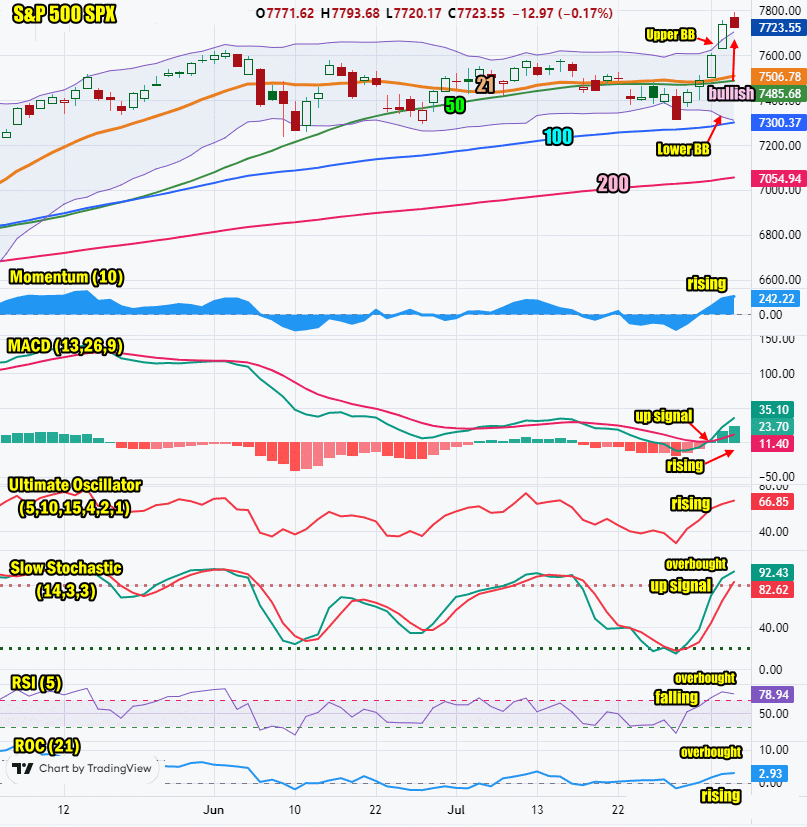
The index ended the day above the Upper Bollinger Band which is bullish.
The closing candlestick has a short shadow which indicates small dips may occur Thursday. The candlestick is bullish.
The 21 day moving average is rising and closed at 7506. This is bullish.
The 50 day moving average is rising and closed at 7485. This is bullish.
The 100 day moving average is rising and closed at 7300. This is bullish.
The 200 day moving average is rising and closed at 7054. This is bullish.
The Lower Bollinger Band is falling. The Upper Bollinger Band is rising. The signal is bullish for stocks.
The SPX chart is bullish for Thu Aug 6 2026 but also advises stocks are overbought and dips could be deeper than anticipated.
SPX Stock Market Outlook review of Wednesday Aug 5 2026
Stock Market Outlook: Technical Indicators Review
Momentum: Momentum is rising and positive. This is bullish.
|
MACD Histogram: MACD (Moving Averages Convergence / Divergence) issued an up signal on Mon Aug 3 2026. The up signal was stronger on Wed Aug 5 2026..
|
Ultimate Oscillator: The Ultimate Oscillator is rising which is bullish.
|
Slow Stochastic: The Slow Stochastic has an up signal in place which is bullish. It is overbought.
|
Relative Strength Index: The RSI signal is falling and overbought. This is neutral.
|
| Rate of Change: The rate of change is rising which is bullish. It is signaling Thursday will be higher. It is not yet into overbought readings but sitting close to it. Settings: Rate Of Change is set for a 21 period. This indicator looks back 21 days and compares price action from the past to the present. With the Rate Of Change, prices are rising when signals are positive. Conversely, prices are falling when signals are negative. As an advance rises, the Rate Of Change signal should also rise higher, otherwise the rally is suspect. A decline should see the Rate Of Change fall into negative signals. The more negative the signals the stronger the decline. |
Stock Market Outlook: Support and Resistance Levels |
| 7800 is resistance |
| 7780 is resistance |
| 7750 is resistance |
| 7700 is resistance |
| 7650 is resistance |
| 7600 is resistance |
| 7590 is resistance |
| 7570 is resistance |
| 7550 is resistance |
| 7500 is resistance |
| 7450 is resistance |
| 7425 is resistance |
| 7400 is support |
| 7370 is support |
| 7350 is support |
| 7300 is support |
| 7280 is support |
| 7250 is support |
| 7200 is support |
Stock Market Outlook for Thu Aug 6 2026
For Thu Aug 6 2026 stocks may open slightly higher and then dip back. The outlook may be swayed by expected dips in Sandisk Stock (SNDK) and Western Digital Stock (WDC) which turned negative after hours on Wednesday.
However with July Non-Farm Payroll Numbers due out on Friday morning, I am expecting a flat to slightly higher close as investors position themselves for the release of the numbers.
Potential Economic and Political Market Moving Events
Monday:
9:45 US Manufacturing PMI for July came in as estimated at 53.9
10:00 ISM Report on Business Manufacturing PMI was higher than estimated at 55.6
10:00 Construction spending for June was lower than estimated coming in at -0.1%
Tuesday:
8:30 Trade for June was poorer than estimated, coming in at -$73.3 billion
10:00 Job openings for June came in as estimated at 7.4 million
10:00 Factory orders for June were lower than estimated coming in at -0.3%
Wednesday:
8:15 ADP National employment Report was almost half of estimated at44,000 for July. This number will probably be revised next month
9:45 USA Services PMI best estimates for July rising 54.6 versus 51.2 prior
Thursday:
8:30 Weekly Initial Unemployment Insurance Claims for Aug 1 are estimated to rise to 204,000 from 197,000 prior
10:00 Monthly wholesale trade for Jun is estimated to rise 0.3% from 0.1%
Friday:
8:30 Employment report is estimated to show 83,000 jobs created, up from 57,000 prior
8:30 Unemployment rate estimated to remain unchanged at 4.2%
8:30 Average hourly earnings month over month is estimated unchanged at 0.3%
8:30 Average hourly earnings year-over-year is estimated unchanged at 3.5%
3:00 Consumer credit for Jun is estimated at 10 billion versus -0.2 billion prior