

Prior Trading Day Summary
On Wed Jul 29 2026 worries about the potential for riding interest rates started the day lower for stocks. The Fed interest rate announcement saw a rebound in the sell-off only to see stocks collapse again as the news conference progressed due to hawkish and sometimes confusing comments from the Fed Chair. Meanwhile bond yields rose. It was a wild roller coaster day with the indexes closing at the lows of the day.
The SPX fell 112 points to close at 7316 on 5.9 billion shares traded. By the close 67% of stocks were falling. It was the worst day since June 10 when the SPX lost 119 points and ended at 7267.
The NASDAQ lost 434 points to 24,442. Volume was 8.6 billion shares traded. The close saw 69% of stocks falling. This was the worst day since Jul 23 last week when the index lost 553 points. However Wednesday’s decline was the 6th straight trading day with the index ending lower.
After hours Meta Stock (META) fell sharply on disappointing earnings along with Qualcomm Stock (QCOM). Microsoft Stock (MSFT) surprised with a strong earnings report and their stock moved higher but the big surprise was Starbucks which beat all estimates and it’s stock soared after hours.
Let’s review the closing technical indicators from Wed Jul 29 2026 to see if the oversold market can bounce on Thursday Jul 30 2026.
Stock Market Outlook: SPX Closing Chart For Wed Jul 29 2026
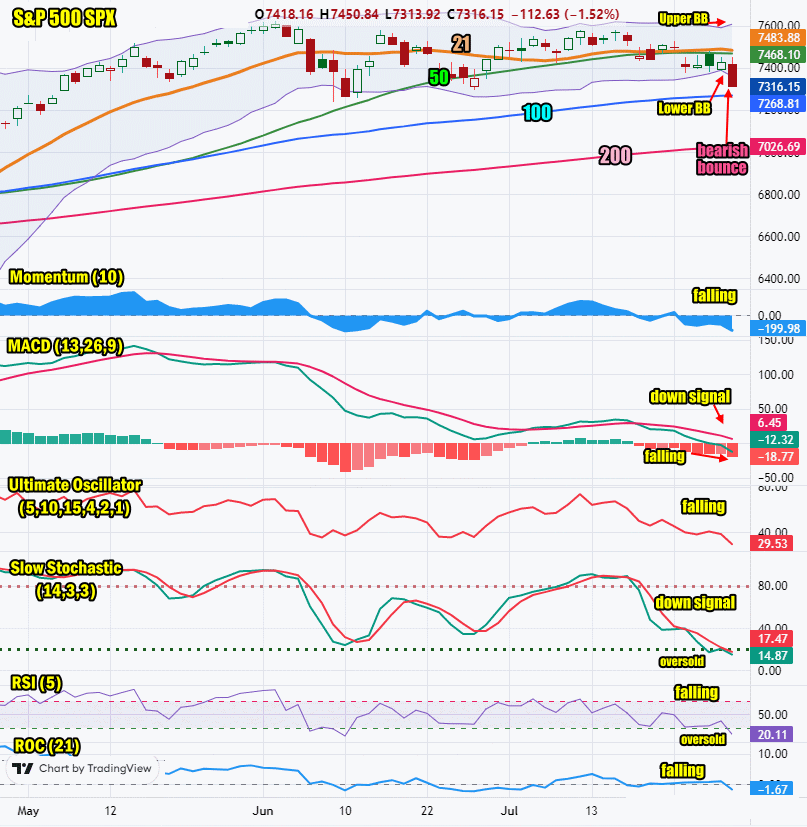
The index ended the day below both the 21 day and 50 day moving averages and the Lower Bollinger Band. This is very bearish.
The closing candlestick has a shadow pointing to a probable bounce attempt for Thursday as the index ended the day just above the 100 day and oversold.
The 21 day moving average is falling and closed at 7483. It is still near the 50 day moving average but has turned bearish. It should fall below the 50 day on Thursday.
The 50 day moving average is falling and closed at 7468. This is bearish.
The 100 day moving average is rising and closed at 7268. This is bullish.
The 200 day moving average is rising and closed at 7026. This is bullish.
The Lower Bollinger Band is falling. The Upper Bollinger Band is rising. The Bollinger Bands Squeeze is over and the Bollinger Bands are signaling lower for stocks.
The SPX chart is more bearish than bullish for Thu Jul 30 2026 but are also signaling stocks are nearing oversold levels where a bounce should be expected.
SPX Stock Market Outlook review of Wed Jul 29 2026
Stock Market Outlook: Technical Indicators Review
Momentum: Momentum is falling and negative. This is bearish.
|
MACD Histogram: MACD (Moving Averages Convergence / Divergence) issued a down signal on Fri Jul 17 2026. On Wed Jul 29 2026 the down signal gained strength.
|
Ultimate Oscillator: The Ultimate Oscillator is falling which is bearish. It is not yet at oversold readings.
|
Slow Stochastic: The Slow Stochastic has a down signal in place. It is at oversold levels. It is signaling that a bounce attempt is possible.
|
Relative Strength Index: The RSI signal is falling and into oversold levels. A bounce is possible.
|
| Rate of Change: The rate of change is falling sharply which is bearish. It is signaling Thursday will end lower. Settings: Rate Of Change is set for a 21 period. This indicator looks back 21 days and compares price action from the past to the present. With the Rate Of Change, prices are rising when signals are positive. Conversely, prices are falling when signals are negative. As an advance rises, the Rate Of Change signal should also rise higher, otherwise the rally is suspect. A decline should see the Rate Of Change fall into negative signals. The more negative the signals the stronger the decline. |
Stock Market Outlook: Support and Resistance Levels |
| 7600 is resistance |
| 7590 is resistance |
| 7570 is resistance |
| 7550 is resistance |
| 7500 is resistance |
| 7450 is resistance |
| 7425 is resistance |
| 7400 is resistance |
| 7370 is support |
| 7350 is support |
| 7300 is support |
| 7280 is support |
| 7250 is support |
| 7200 is support |
| 7175 is support |
| 7150 is support |
| 7125 is support |
| 7100 is good support |
Stock Market Outlook for Thu Jul 30 2026
Wednesday’s market plunge was dramatic and that always makes it seem worse, but the losses were on par with other down days this summer. Only the Dow Jones which was heavily overvalued tumbled the most which was no surprise due to its height. With lower trading volumes, market swings are more pronounced. Not until September gets underway will we see trading volumes climb higher.
On Thursday there is a chance for a rebound early in the morning but a recovery is unlikely. A lower close is anticipated or at the very least a flat close. While earnings were good from Microsoft Stock (MSFT) on Wednesday after the close, it will not be enough to reverse Wednesday’s losses. On Thursday we also get a slew of economic numbers. None of them are expected to impact market direction today.
Potential Economic and Political Market Moving Events
Monday:
8:30 Durable goods for Jun came in lower than estimates at 0.3%
Tuesday:
8:30 Advance Economic Indicators for July
8:30 Wholesale inventories for June are estimated to rise to 0.3%
8:30 Retail inventories for June are estimated to rise to 0.6%
9:00 S&P Cotality Case-Shiller Home SPX Index for May is estimated at 1.1%
10:00 Conference Board Consumer Confidence for July is estimated at 92
Wednesday:
2:00 PM US Interest rate decision – there was no change in interest rates but Fed confusing comments sent stocks lower
Thursday:
8:30 Weekly Initial Unemployment Insurance Claims are estimated at 200,000
8:30 Advanced GDP estimate is at 1.8%
8:30 Personal income month to month is expected to dip to 0.3% from 0.7% prior
8:30 Consumer spending is also estimated to fall to 0.3% from 0.7% prior
8:30 Personal Consumption Expenditures month to month is estimated to fall to -0.1% from 0.4% prior
8:30 PCE price index year-over-year is estimated to fall to 3.7% from 4.1% prior
8:30 PCE Core price month to month is estimated to fall to -0.2% from 0.3% prior
8:30 PCE Core Price index year-over-year is estimated to fall to 3.3% from 3.4%