
Prior Trading Day Summary
On Tue Aug 4 2026 stocks roared higher on good volume as investors poured capital into a broad array of stocks with tech names still leading. By the close on Tuesday, the MACD up signal from Monday’s close was confirmed while at the same time, other technical signals cautioned that stocks are overbought.
The SPX rose 136 points to close at 7736, a new closing high. Intraday the index reached 7758, another new all-time high . Volume was 6 billion shares traded with 65% of all stocks rising by the close. Over the past two days the index has added 246 points which is impressive.
The NASDAQ climbed 671 points ending the day at 26,584. This is 606 points from a new all-time high for the index. Volume was good at 10.2 billion. 73% of all stocks were higher by the close. Over the past two days the NASDAQ has added 1211 points.
The rally has climbed as oil prices have fallen along with bond yields. Let’s look at the closing technical indicators from Tue Aug 4 2026 to see if stocks will continue to rally despite now being heavily overbought.
Stock Market Outlook: SPX Closing Chart For Tue Aug 4 2026
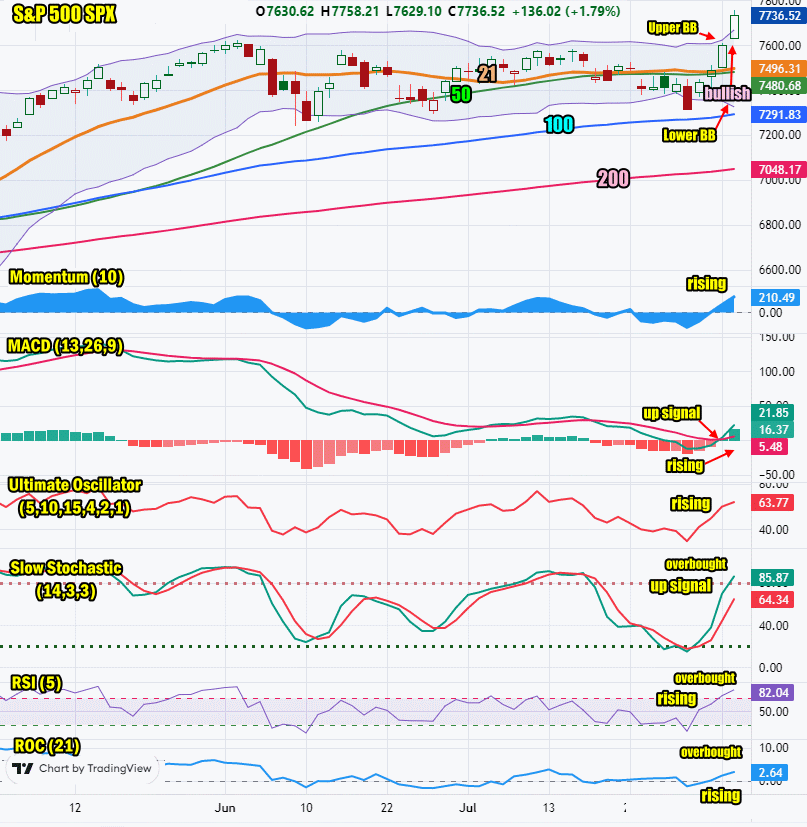
The index ended the day above the Upper Bollinger Band which is bullish.
The closing candlestick has a short shadow which indicates small dips may occur Wednesday. The candlestick is bullish.
The 21 day moving average is rising and closed at 7496. This is bullish.
The 50 day moving average is rising and closed at 7480. This is bullish.
The 100 day moving average is rising and closed at 7291. This is bullish.
The 200 day moving average is rising and closed at 7048. This is bullish.
The Lower Bollinger Band is falling. The Upper Bollinger Band is rising. The Bollinger Bands Squeeze is over and stocks are breaking higher out of the latest squeeze.
The SPX chart is bullish for Wed Aug 5 2026 but also advises stocks are overbought and dips could be deeper than anticipated.
SPX Stock Market Outlook review of Tue Aug 4 2026
Stock Market Outlook: Technical Indicators Review
Momentum: Momentum is rising and positive. This is bullish.
|
MACD Histogram: MACD (Moving Averages Convergence / Divergence) issued an up signal on Mon Aug 3 2026. The up signal was confirmed on Tue Aug 4 2026.
|
Ultimate Oscillator: The Ultimate Oscillator is rising which is bullish.
|
Slow Stochastic: The Slow Stochastic has an up signal in place which is bullish. It is overbought.
|
Relative Strength Index: The RSI signal is rising and overbought. This is bullish.
|
| Rate of Change: The rate of change is rising which is bullish. It is signaling Wednesday will be higher. It is not yet into overbought readings but another bounce on Wednesday will send stocks fully into overbought. Settings: Rate Of Change is set for a 21 period. This indicator looks back 21 days and compares price action from the past to the present. With the Rate Of Change, prices are rising when signals are positive. Conversely, prices are falling when signals are negative. As an advance rises, the Rate Of Change signal should also rise higher, otherwise the rally is suspect. A decline should see the Rate Of Change fall into negative signals. The more negative the signals the stronger the decline. |
Stock Market Outlook: Support and Resistance Levels |
| 7800 is resistance |
| 7780 is resistance |
| 7750 is resistance |
| 7700 is resistance |
| 7650 is resistance |
| 7600 is resistance |
| 7590 is resistance |
| 7570 is resistance |
| 7550 is resistance |
| 7500 is resistance |
| 7450 is resistance |
| 7425 is resistance |
| 7400 is support |
| 7370 is support |
| 7350 is support |
| 7300 is support |
| 7280 is support |
| 7250 is support |
| 7200 is support |
Stock Market Outlook for Wed Aug 5 2026
For Wed Aug 5 2026 the technical indicators are cautionary as many stocks are overbought. There is more room for many stocks to continue to advance but the overbought condition would see stocks dip deeper than expected, at any time. That said, the rally is strong and the MACD confirmed up signal was also strong. It is rare when that signal is generated and then stocks tumble. I am expecting another higher day today but not nearly as strong a day. Advanced Micro Devices Stock (AMD) dipped 9% after hours on Tuesday despite a very strong earnings beat. That could weigh on stocks in the morning today. The afternoon should see stocks climb to a flat or slightly higher close by the end of the day.
Potential Economic and Political Market Moving Events
Monday:
9:45 US Manufacturing PMI for July came in as estimated at 53.9
10:00 ISM Report on Business Manufacturing PMI was higher than estimated at 55.6
10:00 Construction spending for June was lower than estimated coming in at -0.1%
Tuesday:
8:30 Trade for June was poorer than estimated, coming in at -$73.3 billion
10:00 Job openings for June came in as estimated at 7.4 million
10:00 Factory orders for June were lower than estimated coming in at -0.3%
Wednesday:
8:15 ADP National employment Report is estimated to show 75,00 job versus 98,000 prior
9:45 USA Services PMI is estimated to rise to 53.6 for July