
Prior Trading Day Summary
On Thu Jul 30 2026 Microsoft Stock (MSFT) took the lead and indexes followed to end higher. All losses from Wednesday’s Fed induced plunge were forgotten.
The SPX rose 121 points to close at 7437 and recovering all of Wednesday’s plunge. Volume was 5.7 billion shares traded with 55% of all stocks rises by the close. Thursday’s rally turned the index positive for the week.
The NASDAQ soared 679 points wiping out Wednesday’s 434 points loss and ending the day at 25,122. Volume was 9.5 billion, the highest volume since July 2. 63% of all stocks were higher by the close.
After hours many stocks continued their advance including Amazon.com Stock (AMZN) which jumped on better than expected earnings. Sandisk Stock (SNDK) rose 25.9% on Thursday and after hours climbed another 33%. Sandisk earnings are not until Aug 5. Despite some stocks after hours dipping including Apple Stock (AAPL) and Reddit Stock (RDDT), Friday looks bullish.
Let’s review the closing technical indicators from Thu Jul 30 2026 to see if stocks will continue the rally on Fri Jul 31 2026.
Stock Market Outlook: SPX Closing Chart For Thu Jul 30 2026
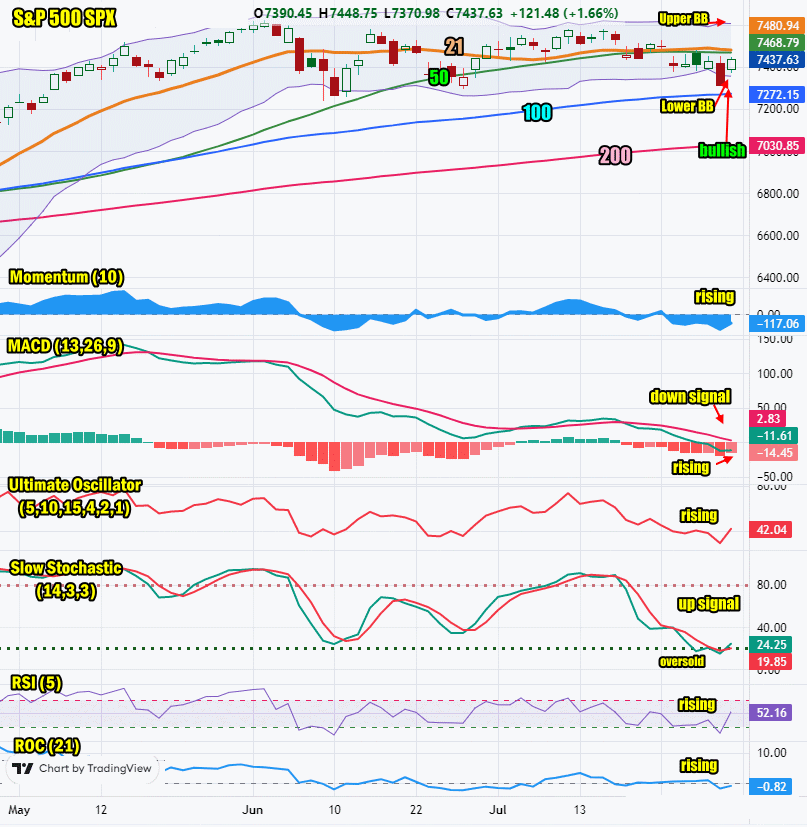
The index ended the day below both the 21 day and 50 day moving averages but back above the Lower Bollinger Band. This is still bearish.
The closing candlestick has small shadows which indicates some dips could happen on Friday but overall it is bullish.
The 21 day moving average is falling and closed at 7480. It is still near the 50 day moving average but above it. This though is bearish.
The 50 day moving average is unchanged and closed at 7468. This is bearish.
The 100 day moving average is rising and closed at 7272. This is bullish.
The 200 day moving average is rising and closed at 7030. This is bullish.
The Lower Bollinger Band is falling. The Upper Bollinger Band is turned sideways. This still points to stocks as having a higher probability of falling than rising.
The SPX chart is more bearish than bullish for Fri Jul 31 2026 but Thursday’s large rally assisted the overall outlook. A strong higher day on Friday or Monday will help for a bullish outlook. Until then the outlook is still bearish.
SPX Stock Market Outlook review of Thu Jul 30 2026
Stock Market Outlook: Technical Indicators Review
Momentum: Momentum is rising and negative. This is bearish.
|
MACD Histogram: MACD (Moving Averages Convergence / Divergence) issued a down signal on Fri Jul 17 2026. On Thu Jul 30 2026 the down signal lost strength.
|
Ultimate Oscillator: The Ultimate Oscillator is rising which is bullish.
|
Slow Stochastic: The Slow Stochastic has an up signal in place. It is at oversold levels.
|
Relative Strength Index: The RSI signal is rising. This is bullish.
|
| Rate of Change: The rate of change is rising which is bullish. It is signaling Friday will end higher. Settings: Rate Of Change is set for a 21 period. This indicator looks back 21 days and compares price action from the past to the present. With the Rate Of Change, prices are rising when signals are positive. Conversely, prices are falling when signals are negative. As an advance rises, the Rate Of Change signal should also rise higher, otherwise the rally is suspect. A decline should see the Rate Of Change fall into negative signals. The more negative the signals the stronger the decline. |
Stock Market Outlook: Support and Resistance Levels |
| 7600 is resistance |
| 7590 is resistance |
| 7570 is resistance |
| 7550 is resistance |
| 7500 is resistance |
| 7450 is resistance |
| 7425 is resistance |
| 7400 is resistance |
| 7370 is support |
| 7350 is support |
| 7300 is support |
| 7280 is support |
| 7250 is support |
| 7200 is support |
| 7175 is support |
| 7150 is support |
| 7125 is support |
| 7100 is good support |
Stock Market Outlook for Fri Jul 31 2026
For Friday the technical indicators have improved for the bulls but a one day rally does not change the underlying bearish trend yet. Friday still looks like it will be higher but dips are more likely. Apple stock disappointed after hours on Thursday which may weigh on the indexes along with a number of other stocks including Reddit Stock (RDDT), Coinbase Stock (COIN), Norwegian Cruise Line Stock (NCLH) and more. The outlook though is still bullish for Friday but a second large rally is not anticipated.
Potential Economic and Political Market Moving Events
Monday:
8:30 Durable goods for Jun came in lower than estimates at 0.3%
Tuesday:
8:30 Advance Economic Indicators for July
8:30 Wholesale inventories for June are estimated to rise to 0.3%
8:30 Retail inventories for June are estimated to rise to 0.6%
9:00 S&P Cotality Case-Shiller Home SPX Index for May is estimated at 1.1%
10:00 Conference Board Consumer Confidence for July is estimated at 92
Wednesday:
2:00 PM US Interest rate decision – there was no change in interest rates but Fed confusing comments sent stocks lower
Thursday:
8:30 Weekly Initial Unemployment Insurance Claims were lower than estimated at 197,000
8:30 Advanced GDP was lower than estimated at 1.5%
8:30 Personal income month to month was lower than estimated at 0.2%
8:30 Consumer spending met estimated at 0.3%
8:30 Personal Consumption Expenditures month to month came in as estimated at -0.1%
8:30 PCE price index year-over-year met estimates at 3.7%
8:30 PCE Core price month to month was 0.1%
8:30 PCE Core Price index year-over-year came in as estimated at 3.3%
Friday:
8:30 Employment cost index is estimated at 0.8%
9:45 Chicago Business Barometer is estimated at 55.7
10:00 University of Michigan Consumer Survey for July is estimated at 54, up from 49.5 pror