
Prior Trading Day Summary
On Fri Jul 31 2026 buyers continued to pour into those stocks that were reporting better than expected earnings like Microsoft Stock (MSFT) and Amazon.com Stock (AMZN), to mention just 2 stocks. By the close indexes were higher again.
The SPX rose 52 points to close at 7489. Volume was 5.5 billion shares traded with 46% of all stocks rising by the close. For the week the S&P was up 77 points and for the month of July the index was down just 10 points. It basically ended the month where it had begun.
The NASDAQ climbed 251 points ending the day at 25,373. Volume was 12.2 billion, the highest volume since Jun 26. 43% of all stocks were higher by the close. For the week the NASDAQ rose 398 points. For the month of July the index was down 840 points.
The week ahead has more earnings reports and ends with the July Non-Farm Payroll Numbers. This is setting up to be another volatile week.
Let’s review the closing technical indicators from Fri Jul 31 2026 to see if stocks will rise to start the month of August.
Stock Market Outlook: SPX Closing Chart For Fri Jul 31 2026
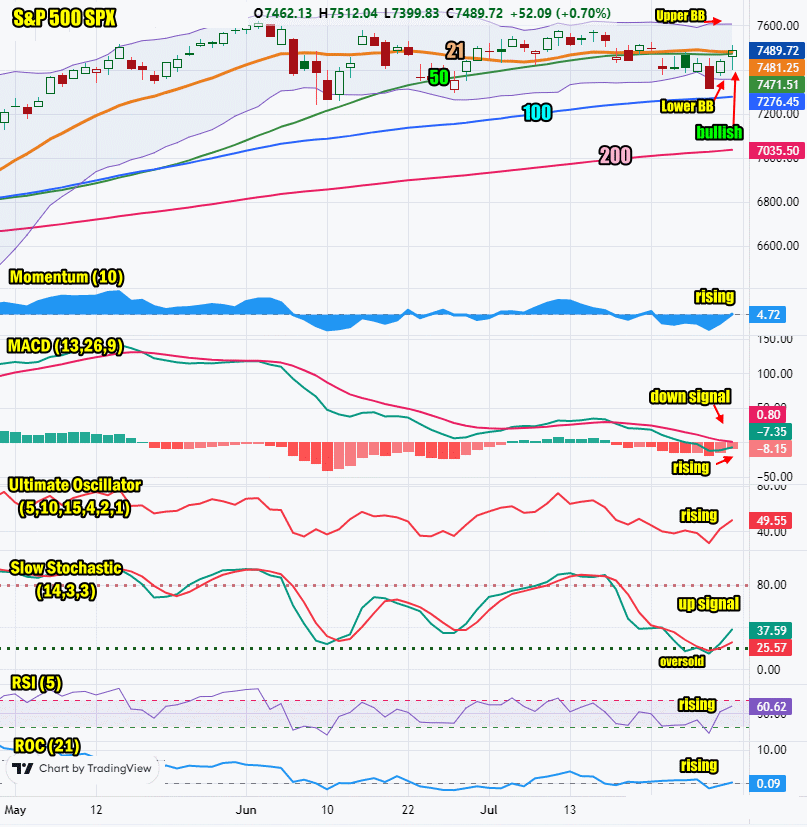
The index ended the day at the 21 day moving average and above the 50 day. It was still below the Upper Bollinger Band which is bearish.
The closing candlestick hasa long shadow which indicates dips should be anticipated today and some could be deeper than expected.
The 21 day moving average is rising and closed at 7481. It is still near the 50 day moving average but above it. This though is bearish.
The 50 day moving average is rising and closed at 7471. This is bearish until the 21 day moves higher.
The 100 day moving average is rising and closed at 7276. This is bullish.
The 200 day moving average is rising and closed at 7035. This is bullish.
The Lower Bollinger Band is falling. The Upper Bollinger Band is turned sideways. This still points to stocks as having a higher probability of falling than rising.
The SPX chart is more bearish than bullish for Mon Aug 3 2026 but signals are pointing to a good chance the index will close still higher.
SPX Stock Market Outlook review of Fri Jul 31 2026
Stock Market Outlook: Technical Indicators Review
Momentum: Momentum is rising and positive. This is bullish.
|
MACD Histogram: MACD (Moving Averages Convergence / Divergence) issued a down signal on Fri Jul 17 2026. On Fri Jul 31 2026 the down signal was almost gone.
|
Ultimate Oscillator: The Ultimate Oscillator is rising which is bullish.
|
Slow Stochastic: The Slow Stochastic has an up signal in place which is bullish.
|
Relative Strength Index: The RSI signal is rising. This is bullish.
|
| Rate of Change: The rate of change is rising which is bullish. It is signaling Monday will end higher. Settings: Rate Of Change is set for a 21 period. This indicator looks back 21 days and compares price action from the past to the present. With the Rate Of Change, prices are rising when signals are positive. Conversely, prices are falling when signals are negative. As an advance rises, the Rate Of Change signal should also rise higher, otherwise the rally is suspect. A decline should see the Rate Of Change fall into negative signals. The more negative the signals the stronger the decline. |
Stock Market Outlook: Support and Resistance Levels |
| 7600 is resistance |
| 7590 is resistance |
| 7570 is resistance |
| 7550 is resistance |
| 7500 is resistance |
| 7450 is resistance |
| 7425 is resistance |
| 7400 is resistance |
| 7370 is support |
| 7350 is support |
| 7300 is support |
| 7280 is support |
| 7250 is support |
| 7200 is support |
| 7175 is support |
| 7150 is support |
| 7125 is support |
| 7100 is good support |
Stock Market Outlook for Mon Aug 3 2026
For Monday the SPX is starting the day at the 7500 valuation level. The SPX chart indicates a good chance for a dip today but a higher close is still expected although the day will be choppy.
More companies are reporting earnings this like Caterpillar Stock (CAT), Palantir Tech Stock (PLTR), McDonalds Stock (MCD), Pfizer Stock (PFE), Advanced Micro Devices Stock (AMD), Walt Disney Stock (DIS) and SpaceX Stock (SPCX) to mention just a few. At week’s end we get the July Non-Farm Payroll Numbers which often see markets turn volatile right after the numbers are released.
For Monday though watch for dips that could surprise with a bit deeper drop but any dip will find ready buyers. The day will end with the SPX higher.
Potential Economic and Political Market Moving Events
Monday:
9:45 US Manufacturing PMI for July is estimated unchanged at 53.9
10:00 ISM Report on Business Manufacturing PMI is estimated at 54, up from 53.3 prior
10:00 Construction spending for June is estimated to rise 0.3% from 0.1% prior