

Prior Trading Day Summary
On Tue Jul 28 2026 indexes struggled for a second day as investors continued to sell semiconductors and move into what many consider “safer” stocks such as Coca Cola Stock (KO) which reported excellent earnings, PepsiCo Stock (PEP), bank stocks and more. Anything not related to chip stocks saw buying.
The SPX gained 15 points to close at 7428 on 5.7 billion shares traded. By the close 61% of stocks were rising.
The NASDAQ lost 55 points to 24,876 but it recovered from a much steeper early decline. Volume was 8.7 billion shares traded. The close saw 47% of stocks rising.
On Wednesday we get the latest interest rate decision from the Fed. While that decision will have the most influence on Wednesday afternoon, the technical indicators are still playing a role in advising investors what to be aware of from a technical nature.
Let’s review the closing technical indicators from Tue Jul 28 2026 to see what to expect for Wed Jul 29 2026.
Stock Market Outlook: SPX Closing Chart For Tue Jul 28 2026
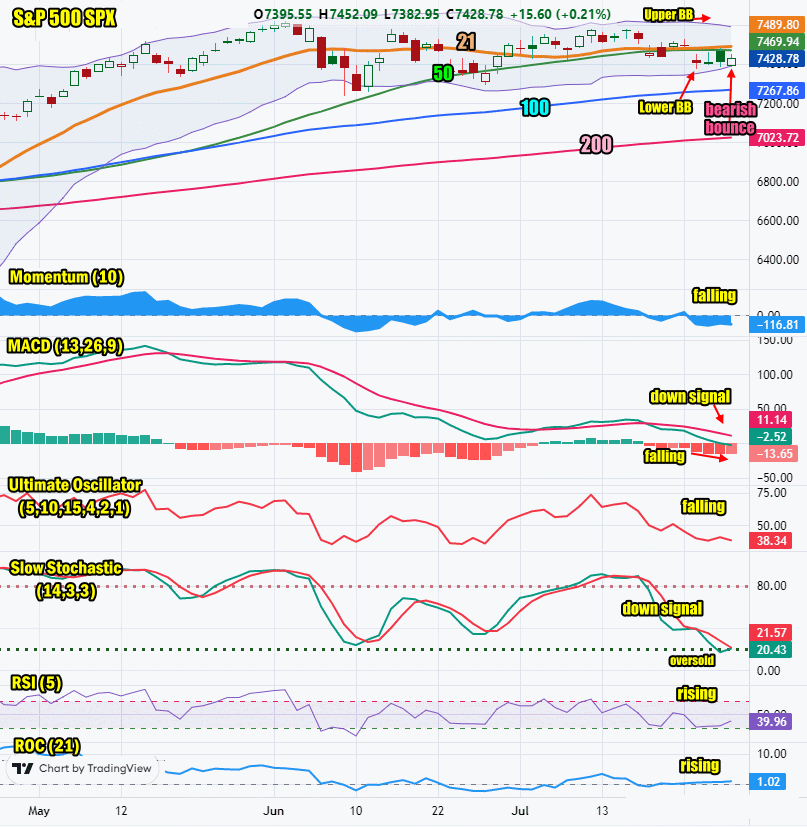
The index ended the day below both the 21 day and 50 day moving averages which is bearish. It did close above the Lower Bollinger Band which is a bit bullish.
The closing candlestick has a shadow pointing to a probable bounce attempt for Wednesday.
The 21 day moving average is rising and closed at 7489. It is still near the 50 day moving average but starting to rise. This is bullish.
The 50 day moving average is falling and closed at 7469. This is bearish.
The 100 day moving average is rising and closed at 7267. This is bullish.
The 200 day moving average is rising and closed at 7023. This is bullish.
The Lower Bollinger Band is rising. The Upper Bollinger Band is falling. The Bollinger Bands Squeeze signaling stocks may fall out of the Bollinger Bands Squeeze.
The SPX chart is more bearish than bullish for Wed Jul 29 2026.
SPX Stock Market Outlook review of Tue Jul 28 2026
Stock Market Outlook: Technical Indicators Review
Momentum: Momentum is falling and negative. This is bearish.
|
MACD Histogram: MACD (Moving Averages Convergence / Divergence) issued a down signal on Fri Jul 17 2026. On Tue Jul 28 2026 the down signal gained strength.
|
Ultimate Oscillator: The Ultimate Oscillator is falling which is bearish.
|
Slow Stochastic: The Slow Stochastic has a down signal in place. It is at oversold levels. It is signaling that an up signal should be issued today as it attempts to bounce.
|
Relative Strength Index: The RSI signal is rising which is bullish and points to a probable bounce.
|
| Rate of Change: The rate of change is rising which is bullish. Settings: Rate Of Change is set for a 21 period. This indicator looks back 21 days and compares price action from the past to the present. With the Rate Of Change, prices are rising when signals are positive. Conversely, prices are falling when signals are negative. As an advance rises, the Rate Of Change signal should also rise higher, otherwise the rally is suspect. A decline should see the Rate Of Change fall into negative signals. The more negative the signals the stronger the decline. |
Stock Market Outlook: Support and Resistance Levels |
| 7600 is resistance |
| 7590 is resistance |
| 7570 is resistance |
| 7550 is resistance |
| 7500 is resistance |
| 7450 is resistance |
| 7425 is resistance |
| 7400 is resistance |
| 7370 is support |
| 7350 is support |
| 7300 is support |
| 7280 is support |
| 7250 is support |
| 7200 is support |
| 7175 is support |
| 7150 is support |
| 7125 is support |
| 7100 is good support |
Stock Market Outlook for Wed Jul 29 2026
Wednesday morning will be weaker and dips are once again likely. The afternoon will belong to the Fed and the latest decision on interest rates. Analysts overwhelming do not believe the Fed will raise rates. Should the Fed raise rates the market will tank. For that reason alone I do not think we will see interest rates rise. After the interest rate decision is announced, the Fed’s news conference at 2:30 will play a strong role in the movement of stock indexes. At present the outlook is for a lower close on Wednesday but that could change quickly, depending on whether the Fed is supportive of stocks or indicates an interest rate hike is coming perhaps as soon as September. That could end the bull market at present.
Potential Economic and Political Market Moving Events
Monday:
8:30 Durable goods for Jun came in lower than estimates at 0.3%
Tuesday:
8:30 Advance Economic Indicators for July
8:30 Wholesale inventories for June are estimated to rise to 0.3%
8:30 Retail inventories for June are estimated to rise to 0.6%
9:00 S&P Cotality Case-Shiller Home SPX Index for May is estimated at 1.1%
10:00 Conference Board Consumer Confidence for July is estimated at 92
Wednesday:
2:00 PM US Interest rate decision – estimates are no change in interest rates