

Prior Trading Day Summary
On Fri Oct 2 2026 stocks rallied strongly on the back on lower than estimated September jobs numbers. Only 29,000 jobs were created, far below estimated. Unemployment rose to 4.2%. As well, jobs were lowered by 60,000 for July and August combined and wage growth was just 3% annually, the slowest since the pandemic. Investors immediately jumped into stocks on the belief the Fed has to hold rates unchanged in October and possibly November as well.
The SPX ended the day up 56 points to close at 7722. Volume fell to 5.4 billion with 58% of all volume being traded higher. New lows fell to just 134. For the week the SPX was down 20 points.
The NASDAQ ended the day higher, up 319 points to 27,190 on 8.2 billion shares traded. By the close 56% of stocks were rising on the index. New lows fell to 289. For the week the index rose 122 points marking 3 weeks in a row of positive gains. It made a new all-time intraday high of 27,353.
With the September jobs numbers surprising with weakness and the unemployment rate rising let’s review the closing technical indicators from Fri Oct 2 2026 to see what they predict for the start of the week.
Stock Market Outlook: SPX Closing Chart For Fri Oct 2 2026
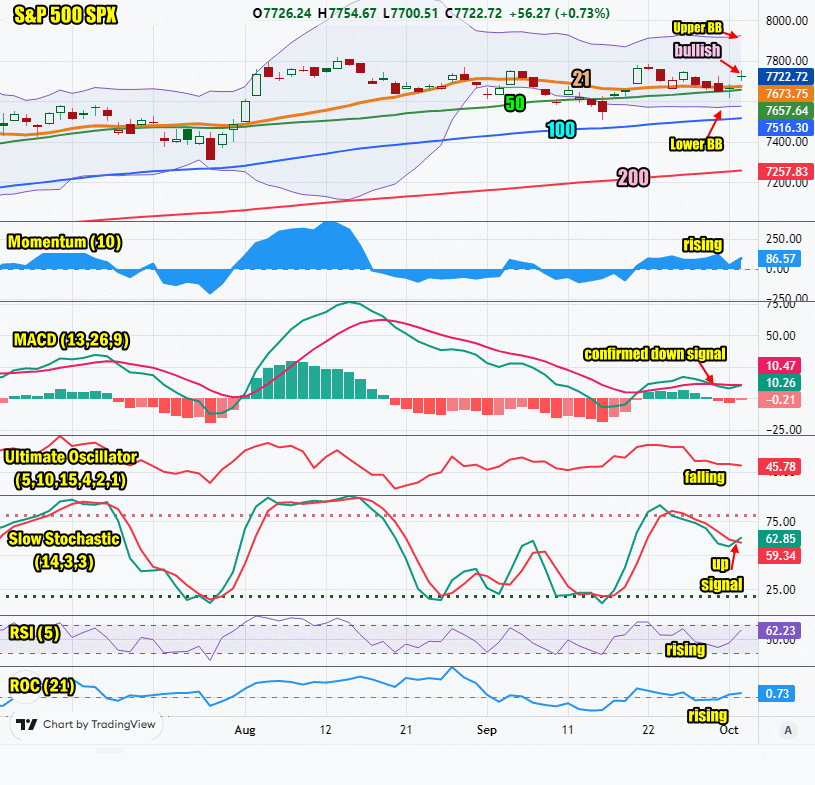
The index ended the day below the Upper Bollinger Band but above the 21 day moving average. This is mildly bullish.
The closing candlestick is bullish but with shadows top and bottom which signal dips and a push higher are likely.
The 21 day moving average is rising and closed at 7673. This is bullish.
The 50 day moving average is rising and closed at 7657. This is bullish.
The 100 day moving average is rising and closed at 7516. This is bullish.
The 200 day moving average is rising and closed at 7257. This is bullish.
The Lower Bollinger Band fell below the 100 day moving average which is bearish. The Upper Bollinger Band is rising which is bullish.
The SPX chart is more bearish that bullish for Mon Oct 5 2026 and is signaling the rally from Friday will see some weakness today.
SPX Stock Market Outlook review of Fri Oct 2 2026
Stock Market Outlook: Technical Indicators Review
Momentum: Momentum is rising and positive. This is bullish.
|
MACD Histogram: MACD (Moving Averages Convergence / Divergence) issued a down signal on Wed Sep 30 2026. The down signal was almost gone on Friday thanks to the large bounce.
|
Ultimate Oscillator: The Ultimate Oscillator is falling. This is bearish.
|
Slow Stochastic: The Slow Stochastic has an up signal in place and is bullish.
|
Relative Strength Index: The RSI signal is rising. This is bullish.
|
| Rate of Change: The rate of change is rising, signaling that Monday will end higher. Settings: Rate Of Change is set for a 21 period. This indicator looks back 21 days and compares price action from the past to the present. With the Rate Of Change, prices are rising when signals are positive. Conversely, prices are falling when signals are negative. As an advance rises, the Rate Of Change signal should also rise higher, otherwise the rally is suspect. A decline should see the Rate Of Change fall into negative signals. The more negative the signals the stronger the decline. |
Stock Market Outlook: Support and Resistance Levels |
| 7800 is resistance |
| 7780 is resistance |
| 7750 is resistance |
| 7700 is resistance |
| 7650 is resistance |
| 7600 is resistance |
| 7590 is resistance |
| 7570 is resistance |
| 7550 is resistance |
| 7500 is support |
| 7450 is support |
| 7425 is support |
| 7400 is support |
Stock Market Outlook for Mon Oct 5 2026
The morning looks weak for the start of the week but the afternoon looks stronger with a higher close likely. They are no economic reports of consequence for Monday which should aid stocks in moving higher in the afternoon into the close.
Potential Economic and Political Market Moving Events
Monday:
10:00 ISM Report on business services PMI for Sep is estimated at 55, down only slightly from 55.4 prior