

Friday started off with a rally that pushed the SPX to 2885. But sellers took charge in the afternoon and the index struggled to stay positive. By the end of the day, the S&P had turned negative and closed at 2859.
Stock Market Outlook Chart Comments At The Close on Fri May 17 2019
On Friday the index closed back below the 50 day moving average and below the 21 day. The closing candlestick is bearish for Monday.
The lower Bollinger Bands is still falling as is the 21 day moving average. The Lower Bollinger Band is ready to fall below the 100 day moving average which will be another bearish signal if it happens.
The 50 day is beginning to weaken but the 100 and 200 day moving averages are still climbing.
The chart is bearish for the start of the week.

Stock Market Outlook review of Fri May 17 2019
Stock Market Outlook: Technical Indicators Review:
Momentum: Momentum is negative and falling.
- Settings: For momentum I use a 10 period when studying market direction.
MACD Histogram: MACD (Moving Averages Convergence / Divergence) issued a down signal on Wednesday May 1. On Friday the down signal was weaker than Thursday.
- Settings: For MACD Histogram, I am using the Fast Points set at 13, Slow Points at 26 and Smoothing at 9.
Ultimate Oscillator: The Ultimate Oscillator signal is falling.
- Settings: The Ultimate Oscillator settings are: Period 1 is 5, Period 2 is 10, Period 3 is 15, Factor 1 is 4, Factor 2 is 2 and Factor 3 is 1. These are not the default settings but are the settings I use with the S&P 500 chart set for 1 to 3 months.
Slow Stochastic: The Slow Stochastic has an up signal in place.
- Settings: For the Slow Stochastic I use the K period of 14 and D period of 3. The Slow Stochastic tries to predict the market direction further out than just one day.
Relative Strength Index: The RSI signal is rising.
- Settings: The relative strength index is set for a period of 5 which gives it 5 days of market movement to monitor. It is often the first indicator to show an overbought or oversold signal.
Rate of Change: The rate of change signal is moving sideways which indicates prices are not expected to change by much on Monday.
- Settings: Rate Of Change is set for a 21 period. This indicator looks back 21 days and compares price action from the past to the present. With the Rate Of Change, prices are rising when signals are positive. Conversely, prices are falling when signals are negative. As an advance rises the Rate Of Change signal should also rise higher, otherwise the rally is suspect. A decline should see the Rate Of Change fall into negative signals. The more negative the signals the stronger the decline.
Support Resistance Levels To Be Aware Of:
2950 is resistance
2900 is light support
2860 is light support
2830 is light support
2800 is strong support
2795 is light support
2745 to 2750 is light support
2725 is light support
2700 is light support
2675 is light support
2650 is support
2625 is light support
2600 is support.
There was good support at the 2550 level which is back to being support.
The 2500 level is support.
The S&P has light support at 2480 and better support at 2450.
There is good support at 2425.
Below that there is some support at 2400, 2380, 2350.
Stock Market Outlook for Tomorrow – Mon May 20 2019
The technical indicators are still mixed. There are 3 signals falling, one signal sideways, one signal rising, one up signal and one down signal.
Investors should be able to maintain an upward bias as long as China does not retaliate further with trade with the USA. If they do, the index will fall back.
For Monday I am expecting deeper dips which will be opportunities to place more trades.
Overall the market is showing signs of staying sideways but keeping a slight bias up. For that reason I am expecting a close that will be slightly higher.
Stock Market Outlook Archives
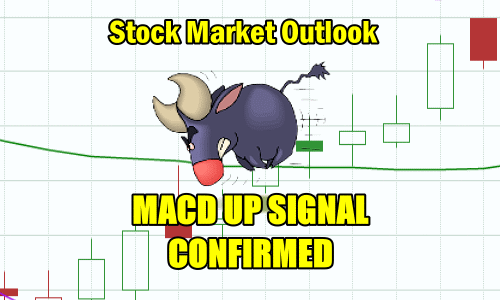
Stock Market Outlook for Tue May 7 2024 – MACD Up Signal Confirmed
Morning Investing Strategy Notes for Mon May 6 2024

Stock Market Outlook for Mon May 6 2024 – Unconfirmed MACD Up Signal

Morning Investing Strategy Notes for Fri May 3 2024
Stock Market Outlook for Fri May 3 2024 – All About The April Non-Farm Payroll Report

Morning Investing Strategy Notes for Thu May 2 2024
Stock Market Outlook for Thu May 2 2024 – Potential Bounce But Lower

Morning Investing Strategy Notes for Wed May 1 2024
Stock Market Outlook for Wed May 1 2024 – Bounce But Lower – Fed Interest Rate Decision

Morning Investing Strategy Notes for Tue Apr 30 2024
Stock Market Outlook for Tue Apr 30 2024 – Dips Likely – Flat To Higher Close

Morning Investing Strategy Notes for Mon Apr 29 2024
Stock Market Outlook for Mon Apr 29 2024 – Some Weakness But Higher

Morning Investing Strategy Notes for Fri Apr 26 2024
Stock Market Outlook for Fri Apr 26 2024 – Higher and Positive Close
