
Prior Trading Day Summary:
On Friday stocks continued their advance and closed up 41 points to end the day at 5958. The SPX closed at the day’s high on 4.9 billion shares traded, the lowest volume of the week. 68% of all stocks were rising on Friday. For the week, the S&P rose every day to gain 298 points for the best one week of 2025.
The NASDAQ rose 98 points on 11 million shares traded. 62% of all stocks were rising. For the week, the NASDAQ rose 1282 points. It was also the best week of 2025.
With most stocks overbought but the bulls still well in charge, let’s review the technical indicators from the close on Fri May 16 2025 to see what we should expect for Mon May 19 2025.
Stock Market Outlook: SPX Closing Chart For Fri May 16 2025
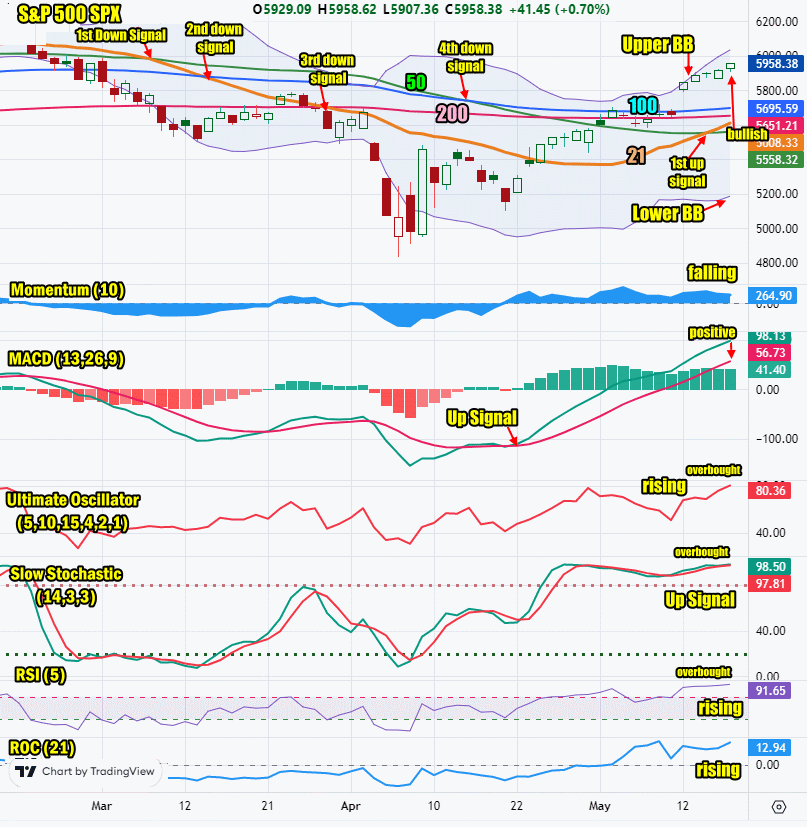
The index closed above all major moving averages and below the Upper Bollinger Band. This signals overbought. After 3 days of drifting sideways, the index moved higher on Friday.
The closing candlestick is bullish but with along shadow indicating some dips are likely, perhaps deeper than expected. Dips are still opportunities to place trades.
The 21 day moving average is rising and closed at 5608 which is bullish. On Wednesday the 21 day crossed above the 50 day, the first up signal from the 21 day moving average. This reversed the 5th down signal in the SPX chart.
The 50 day moving average is rising and closed at 5558 which is bullish. The 50 day moving average fell below the 100 day on Tue April 15 which issued a 4th down signal on the SPX.
The 100 day moving average is rising and closed at 5695 which is bullish.
The 200 day moving average is rising and closed at 5651 which is bullish.
The Lower Bollinger Band is turning higher which is bullish. The Upper Bollinger Band is rising which is bullish.
For Mon May 19 2025 the SPX chart is more bullish than bearish with continuing warnings of the market dipping being likely.
SPX Stock Market Outlook review of Fri May 16 2025
Stock Market Outlook: Technical Indicators Review
Momentum: Momentum is falling and positive.
|
MACD Histogram: MACD (Moving Averages Convergence / Divergence) issued an up signal on Tue Apr 22 2025. On Fri May 16 the up signal lost some strength.
|
Ultimate Oscillator: The Ultimate Oscillator is rising and overbought.
|
Slow Stochastic: The Slow Stochastic has an up signal at the close and is overbought.
|
Relative Strength Index: The RSI signal is rising and overbought.
|
| Rate of Change: The rate of change signal is rising, signaling a higher close is expected on Monday. Settings: Rate Of Change is set for a 21 period. This indicator looks back 21 days and compares price action from the past to the present. With the Rate Of Change, prices are rising when signals are positive. Conversely, prices are falling when signals are negative. As an advance rises, the Rate Of Change signal should also rise higher, otherwise the rally is suspect. A decline should see the Rate Of Change fall into negative signals. The more negative the signals the stronger the decline. |
Stock Market Outlook: Support and Resistance Levels |
| 6000 is resistance |
| 5990 is resistance |
| 5975 is resistance |
| 5950 is resistance |
| 5925 is resistance |
| 5900 is resistance |
| 5850 is resistance |
| 5800 is resistance |
| 5785 is resistance |
| 5750 is support |
| 5700 is support |
| 5650 is support |
| 5630 is support |
| 5600 is support |
| 5550 is support |
| 5500 is support |
| 5475 is support |
| 5450 is support |
| 5400 is support |
Stock Market Outlook for Mon May 19 2025
For Monday two more support levels have been added to the rally. The 5700 and 5750 valuations have moved back into support levels from being resistance during the market collapse in early April. The SPX is now pushing into the heavier resistance levels as it heads toward 6000. These have been added to the support/resistance chart above.
To start the week the technical indicators are showing the index as very overbought and due to pullback or dip at any time. Markets though can keep climbing, especially overbought markets, as investors chase a stock rally higher. On the weekend Moody’s downgraded US credit rating due to the climbing debt but basically they are finally joining the other rating agencies. Moody’s moved the ratings to AA1 from AAA. We could see a dip at the open as some nervous investors may react but overall, this was to be expected and probably long overdue. Most investors, I think, won’t be concerned. Therefore a dip on Monday morning will probably find ready buyers eager to take advantage of any stocks that fall, in particular big cap names.
For Monday I expect weakness in the morning but a flat to higher close to end the day.
Potential Economic and Political Market Moving Events
Monday:
10:00 Leading economic indicators are expected to dip to -0.9% from -0.7% prior – I am not expecting this report will have any effect on the day’s trading direction.