

FullyInformed.com
Generic filters

Stock Market Outlook For Thu Oct 15 2026 -Bounce Possible But Lower and Bearish

Oct 15, 2026 | Stock Market Outlook

Stock Market Outlook bearish


Prior Trading Day Summary

On Wed Oct 14 2026 bank earnings from Morgan Stanley Stock (MS) and Bank Of America Stock (BAC) failed to excite any investors and both stocks plunged after earnings were released before the open. The real culprit though was the Consumer Price Index or CPI which jumped from 3.4% prior to 3.7% for September. Core CPI year-over-year rose to 2.6% from 2.4% for Sep. These CPI numbers immediately grabbed everyone’s attention as being too inflationary and stocks moved lower as a result.

The SPX lost 86 points to close at 7718. Volume jumped to 6.1 billion shares with 330 new weekly lows and 49 new highs. 68% of all volume was being traded lower and 74% of all stocks closed higher.

The NASDAQ fell 511 points to close at 26,692. Volume was higher at 9 billion shares traded. New lows rose to 692 and new highs fell to 43. 73% of all volume was being traded lower and by the close 75% of all stocks were lower.

Wednesday as you can tell from the stats above was a particularly bearish day.

Let’s review the closing technical indicators from Wed Oct 14 2026 to see what they predict for Thu Oct 15 2026.


Stock Market Outlook: SPX Closing Chart For Wed Oct 14 2026 

The index ended the day below the Upper Bollinger Band but down at the 21 day and 50 daymoving averages. This is bearish.

The closing candlestick is bearish for Thursday and the closing shadows indicate a bounce is possible but won’t hold, yet.

The 21 day moving average is rising and closed at 7724. This is bullish.

The 50 day moving average is unchanged and closed at 7707. This is bullish.

The 100 day moving average is rising and closed at 7556. This is bullish.

The 200 day moving average is rising and closed at 7295. This is bullish.

The Lower Bollinger Band is below the 21 and 50 day moving average and rising which is bearish. The Upper Bollinger Band isfalling which is bearish.

The SPX chart is equally split between bull and bear scenarios for Thursday.
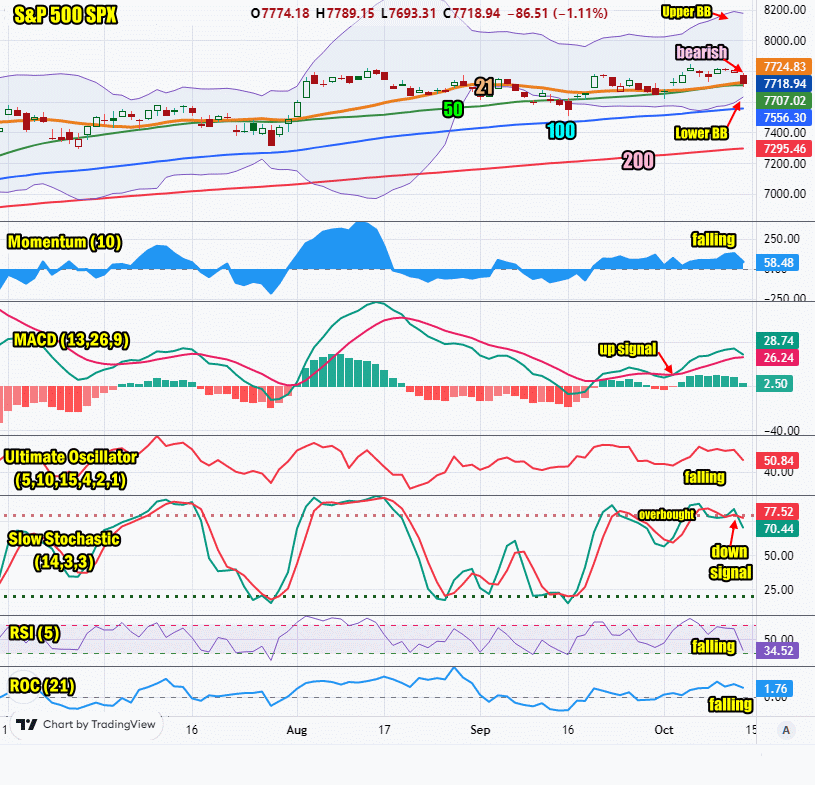
SPX Stock Market Outlook review of Wed Oct 14 2026


Stock Market Outlook: Technical Indicators Review

Momentum: Momentum isfalling and positive. This is bearish.

  • Settings: For momentum I use a 10 period when studying market direction.
MACD Histogram: MACD (Moving Averages Convergence / Divergence) issued an up signal on Mon Oct 5 2026. The up signal was almost gone on Wed Oct 14 2026.

  • Settings: For MACD Histogram, I am using the Fast Points set at 13, Slow Points at 26 and Smoothing at 9.
Ultimate Oscillator: The Ultimate Oscillator is falling which is bearish.

  • Settings: The Ultimate Oscillator settings are: Period 1 is 5, Period 2 is 10, Period 3 is 15, Factor 1 is 4, Factor 2 is 2 and Factor 3 is 1. These are not the default settings but are the settings I use with the S&P 500 chart set for 1 to 3 months.
Slow Stochastic: The Slow Stochastic has a weak down signal in place and is overbought. This is bullish.

  • Settings: For the Slow Stochastic I use the K period of 14 and D period of 3. The Slow Stochastic tries to predict the market direction further out than just one day.
Relative Strength Index: The RSI signal is falling sharply. This is bearish.

  • Settings: The relative strength index is set for a period of 5 which gives it 5 days of market movement to monitor. It is often the first indicator to show an overbought or oversold signal.
Rate of Change: The rate of change is falling, signaling that Thursday will end lower.

Settings: Rate Of Change is set for a 21 period. This indicator looks back 21 days and compares price action from the past to the present. With the Rate Of Change, prices are rising when signals are positive. Conversely, prices are falling when signals are negative. As an advance rises, the Rate Of Change signal should also rise higher, otherwise the rally is suspect. A decline should see the Rate Of Change fall into negative signals. The more negative the signals the stronger the decline.


Stock Market Outlook: Support and Resistance Levels

7850 is resistance
7825 is resistance
7800 is resistance
7780 is resistance
7750 is resistance
7700 is resistance
7650 is resistance
7600 is support
7570 is support
7550 is support
7500 is support


Stock Market Outlook for Thu Oct 15 2026 

With the latest PPI numbers due out today, investors may return to selling if the numbers are stronger than expected. At the same time stocks are oversold after Thursday’s fall which makes for a chance of a bounce. I don’t think any attempt will last on Thursday and the end of the day will see stocks lower.


Potential Economic and Political Market Moving Events

Monday:

No reports

Tuesday:

6:00 NFIB Index of Small Business Optimism for Sep was lower than estimated at 97.9

10:00 Existing home sales for Sep came in as estimated at 4 million

Wednesday:

8:30 Consumer Price Index for Sep rose to 0.6% from 0.4%, higher than estimated

8:30 Core CPI month over monthwas unchanged for Sep coming in at 0.3%

8:30 CPI year-over-year for Sep rose more than estimated to 3.7% from 3.4% prior which sent stocks lower

8:30 Core CPI year over year for Sep rose to 2.6% from 2.4% prior

2:00 Fed’s Beige Book is not expected to point to anything new

2:00 Monthly Treasury Balance for Sep is estimated to rose to -29B versus -167B prior

Thursday:

8:30 Empire State Manufacturing survey for Oct is estimated at 10.3 up from 7.6 prior

8:30 Retail sales for Sep is estimated at 0.4% down from 1.2% prior

8:30 Weekly Initial Unemployment Insurance Claims for Oct 10 are estimated at 200,000 up from 197,000 prior

8:30 Producer Price Index or PPI for Sep is estimated to rise to 5.5% from 5.4% prior


Recent Outlooks

Morning Investing Strategy Notes for Wed Oct 14 2026

For FullyInformed Members the morning Investing Strategy Notes for Wed Oct 14 2026 review the outlook for Wednesday following rather unexciting bank earnings on Tuesday. Equities discussed today include MasterCard Stock (MA), Walt Disney Stock (DIS), Johnson and Johnson Stock …

Stock Market Outlook For Wed Oct 14 2026 – Weakness On Disappointing Bank Earnings

Prior Trading Day Summary On Tue Oct 13 2026 bank earnings largely disappointed investors. Most investors were hoping for a blow out quarter but in general bank balance sheets are complex, filled with a wide variety of instruments from loans, …

Morning Investing Strategy Notes for Tue Oct 13 2026

For FullyInformed Members the morning Investing Strategy Notes for Tue Oct 13 2026 review the outlook for the market following bank earnings. Equities discussed today include Goldman Sachs Stock (GS), JP Morgan Chase Stock (JPM), Johnson and Johnson Stock (JNJ), …

Stock Market Outlook For Tue Oct 13 2026 – All About Bank Earnings

Prior Trading Day Summary On Mon Oct 12 2026 stock indexes saw low volume thanks partly to Columbus Day and bonds not trading along with preparation for bank earnings which start on Tuesday. The SPX lost just 4 points to …

Morning Investing Strategy Notes for Mon Oct 12 2026

For FullyInformed Members the morning Investing Strategy Notes for Mon Oct 12 2026 review the outlook for the start of the second week of October. Equities discussed today include Moderna Stock (MRNA), Apple Stock (AAPL), JP Morgan Chase Stock (JPM), …

Stock Market Outlook For Mon Oct 12 2026 – Higher Ahead Of Bank Earnings

Prior Trading Day Summary On Fri Oct 9 2026 stock indexes climbed higher into the close with the SPX rising 46 points to close at 7811 a few points below its recent all-time high. Volume was just 4.8 billion shares …

Morning Investing Strategy Notes for Fri Oct 9 2026

For FullyInformed Members the morning Investing Strategy Notes for Fri Oct 9 2026 look at the sell-off from Thu Oct 8 2026. Equities discussed today include the Delta Air Lines Stock (DAL), Chevron Stock (CVX), Amgen Stock (AMGN), Apple Stock …

Stock Market Outlook For Fri Oct 9 2026 – Weakness Continues

Prior Trading Day Summary On Thu Oct 8 2026 stock indexes were lower as crude oil prices surged but also as Open AI annual earnings were reported by the Financial Times to be lower by $20 billion than estimates. This …

Morning Investing Strategy Notes for Thu Oct 8 2026

For FullyInformed Members the morning Investing Strategy Notes for Thu Oct 8 2026 look at the weakness seen on Wed Oct 7 2026 in the markets.. Equities discussed today include the Delta Air Lines Stock (DAL), Chevron Stock (CVX), Amgen …

Stock Market Outlook For Thu Oct 8 2026 – Weakness With Dips Likely But Bias Is Still Up

Prior Trading Day Summary On Wed Oct 7 2026 rising treasury yields with the 10 year near 5.3%. Combine this with rising oil prices and stocks indexes at all-time highs and many investors decided to take some of their profits …

Morning Investing Strategy Notes for Wed Oct 7 2026

For FullyInformed Members the morning Investing Strategy Notes for Wed Oct 7 2026 look at the state of the 3 day rally as we head into the 4th day. Equities discussed today include the SPY ETF, Apple Stock (AAPL), Home …

Stock Market Outlook For Wed Oct 7 2026 – MACD Up Signal Confirmed But Dips Likely

Prior Trading Day Summary On Tue Oct 6 2026 stocks continued the rally for a third day and set a new intraday high in both the SPX and NASDAQ. The SPX ended the day up 45 points to close at …

Morning Investing Strategy Notes for Tue Oct 6 2026

For FullyInformed Members the morning Investing Strategy Notes for Tue Oct 6 2026 review the chance for the rally to continue into a third day. Equities discussed today include the SPY ETF, Meta Stock (META), Tesla Stock (TSLA) and more …

Stock Market Outlook For Tue Oct 6 2026 – Unconfirmed MACD Up Signal

Prior Trading Day Summary On Mon Oct 5 2026 stocks rallied despite rising bond yields. Oil prices remained under some pressure. Markets were mixed with some stocks like NVIDIA Stock (NVDA), Meta Stock (META), Microsoft Stock (MSFT), Tesla Stock (TSLA) …

Subscribe For The Latest News