

Prior Trading Day Summary
Today is the anniversary of the Market Crash Of Oct 19 1987. I was quite a bit younger back then but recall the collapse which stunned investors and the Fed. They reacted quickly and restored confidence almost overnight. It still took time for many stocks to recover but the collapse of Oct 19 1987 is a reminder that anything is possible when momentum swings down and investors lose confidence.
Last week the SPX lost 152 points the worst drop since the first week of June when the SPX lost 196 points. The NASDAQ lost 1226 thanks to Friday’s drop of 572 points. This is the worst week since the first week of June when the index lost 1263 points.
These types of declines can test the nerve of even the best investors. Friday saw a strong down signal from the MACD technical indicator but it also saw all the technical indicators fall. That should setup a bounce for the open today.
Let’s review the closing technical indicators from Fri Oct 16 2026 to see what they predict for Mon Oct 19 2026.
Stock Market Outlook: SPX Closing Chart For Fri Oct 16 2026
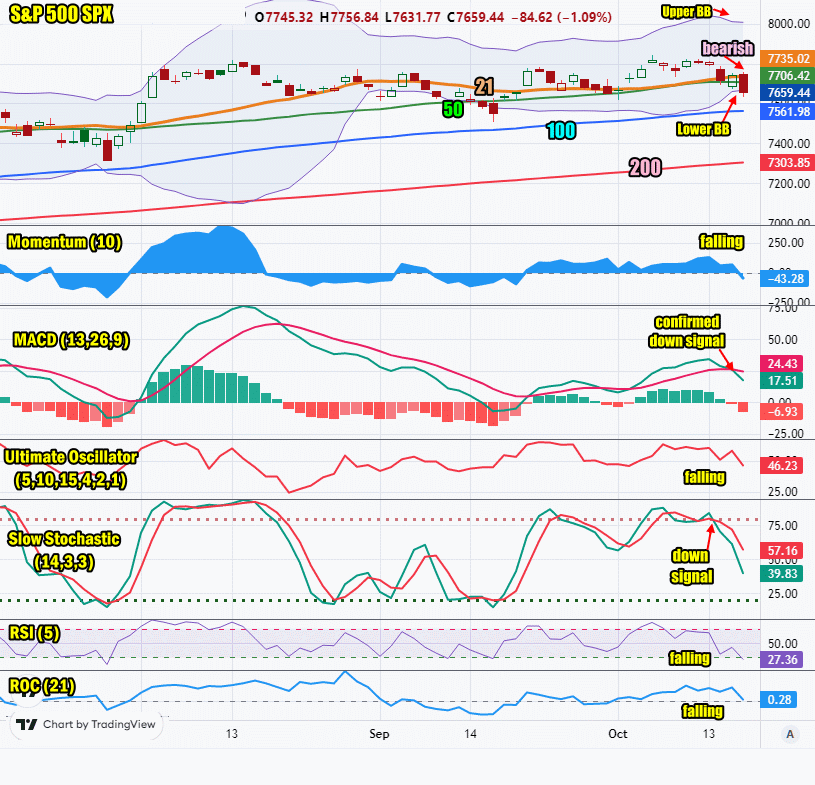
The index ended the day below the Upper Bollinger Band and below the 21 and 50 day moving averages. This is bearish.
The closing candlestick is bearish for Monday but with a lower shadow which signals the index is very oversold. Normally we should expect a bounce.
The 21 day moving average is rising and closed at 7735. This is bullish.
The 50 day moving average is falling and closed at 7706. This is bearish.
The 100 day moving average is rising and closed at 7561. This is bullish.
The 200 day moving average is rising and closed at 7303. This is bullish.
The Lower Bollinger Band is below the 21 and 50 day moving average and sitting at the closing on Friday. This is bearish. The Upper Bollinger Band is falling which is bearish.
The SPX chart is more bearish than bullish for the star of the week despite a bounce being likely.
SPX Stock Market Outlook review of Friday Oct 16 2026
Stock Market Outlook: Technical Indicators Review
Momentum: Momentum is falling and negative. This is bearish.
|
MACD Histogram: MACD (Moving Averages Convergence / Divergence) issued a down signal on Thu Oct 15 2026. The down signal was confirmed on Friday.
|
Ultimate Oscillator: The Ultimate Oscillator is falling which is bearish..
|
Slow Stochastic: The Slow Stochastic has a down signal in place and is bearish.
|
Relative Strength Index: The RSI signal is falling sharply and bearish.
|
| Rate of Change: The rate of change is falling, signaling that Monday will end lower. Settings: Rate Of Change is set for a 21 period. This indicator looks back 21 days and compares price action from the past to the present. With the Rate Of Change, prices are rising when signals are positive. Conversely, prices are falling when signals are negative. As an advance rises, the Rate Of Change signal should also rise higher, otherwise the rally is suspect. A decline should see the Rate Of Change fall into negative signals. The more negative the signals the stronger the decline. |
Stock Market Outlook: Support and Resistance Levels |
| 7850 is resistance |
| 7825 is resistance |
| 7800 is resistance |
| 7780 is resistance |
| 7750 is resistance |
| 7700 is resistance |
| 7650 is resistance |
| 7600 is support |
| 7570 is support |
| 7550 is support |
| 7500 is support |
Stock Market Outlook for Mon Oct 19 2026
Last week was all about bailing out of tech stocks with a focus on the AI stocks but by Friday the selling had spread to other stocks, particularly those that have run higher. We may see that selling continue today despite the market being oversold.
There is a good chance for a bounce to start the day but I will be staying cautious to start the week until there are clearer signals advising the selling will dry up. Presently the signals point to the indexes moving still lower. The next two weeks leading to the mid-terms have a history of being volatile. This year stocks may follow that trend.
Potential Economic and Political Market Moving Events
Monday:
10:00 NAHB Housing Market Index for Oct is estimated to slip to 31 from 32 prior – this is bearish