

Prior Trading Day Summary
On Thu Oct 22 2026 stocks tumbled with the prime focus on tech names once again. Investors worried about the AI spending amounts particularly after META earnings showed its first negative free cash flow in more than 10 years due to its massive capital AI infrastructure expenditures. It’s plan to issue more non-voting shares did not go over well with existing investors as it dilutes their value in the stock. Add in rising oil prices once again and stocks were beaten down on Thursday after 3 days of a rally.
The SPX fell 94 points to close at 7663 and for the week it is now up just 4 points. Volume rose to 6 billion. Despite the drop, 52% of all volume was to the upside and 56% of stocks were rising by the close.
The NASDAQ fell 694 points closing at 26,008. Volume rose to 9.1 billion and new highs rose to 110. New lows though rose to 455 which is very bearish. Up volume comprised 43% of all trading and 56% of all stocks on the index were falling. For the week the index is down 131 points.
Let’s review the closing technical indicators from Thu Oct 22 2026 to see what they predict for Fri Oct 23 2026.
Stock Market Outlook: SPX Closing Chart For Thu Oct 22 2026
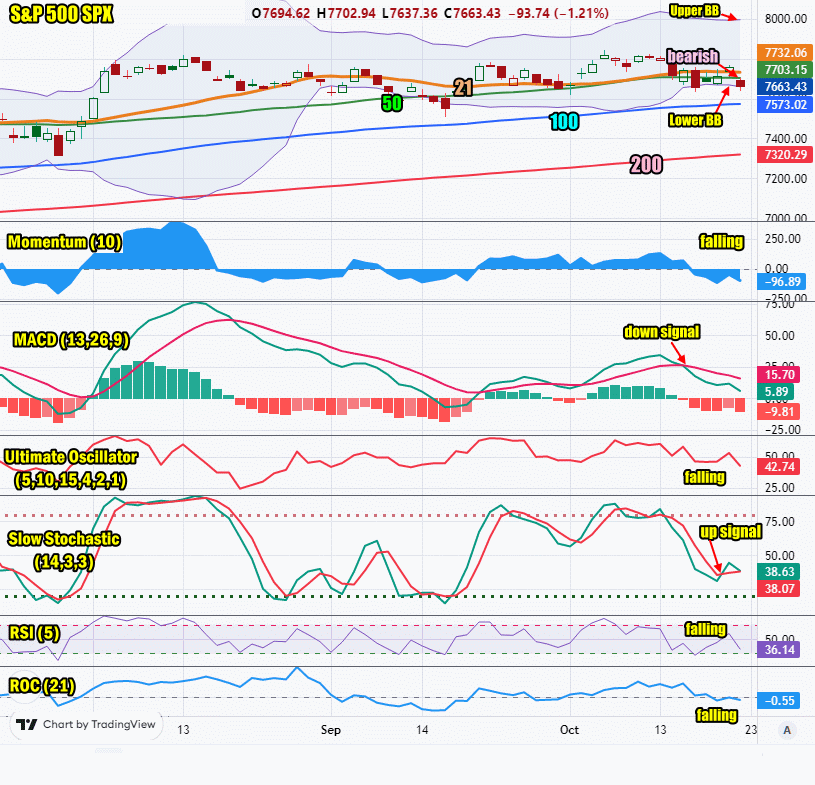
The index ended the day below the Upper Bollinger Band ande the 21 and 50 day moving averages. This is bearish.
The closing candlestick is bearish for Friday but with a bottom shadow which often signals a bounce should be expected.
The 21 day moving average is falling and closed at 7732. This is bearish.
The 50 day moving average is falling and closed at 7703. This is bearish.
The 100 day moving average is rising and closed at 7573. This is bullish.
The 200 day moving average is rising and closed at 7320. This is bullish.
The Lower Bollinger Band is below the 21 and 50 day moving average and turning sideways. This is neutral. The Upper Bollinger Band is turning sideways which is also neutral. We may see a bounce today.
The SPX chart is more bearish than bullish for Friday but is signaling a good chance of a bounce.
SPX Stock Market Outlook review of Thu Oct 22 2026
Stock Market Outlook: Technical Indicators Review
Momentum: Momentum is falling and negative. This is still bearish.
|
MACD Histogram: MACD (Moving Averages Convergence / Divergence) issued a down signal on Thu Oct 15 2026. The down signal was stronger on Thu Oct 22 2026.
|
Ultimate Oscillator: The Ultimate Oscillator is falling which is bearish.
|
Slow Stochastic: The Slow Stochastic has a very weak up signal in place and is more neutral than bullish.
|
Relative Strength Index: The RSI signal is falling which is bearish.
|
| Rate of Change: The rate of change is falling signaling that Friday will end lower. Settings: Rate Of Change is set for a 21 period. This indicator looks back 21 days and compares price action from the past to the present. With the Rate Of Change, prices are rising when signals are positive. Conversely, prices are falling when signals are negative. As an advance rises, the Rate Of Change signal should also rise higher, otherwise the rally is suspect. A decline should see the Rate Of Change fall into negative signals. The more negative the signals the stronger the decline. |
Stock Market Outlook: Support and Resistance Levels |
| 7850 is resistance |
| 7825 is resistance |
| 7800 is resistance |
| 7780 is resistance |
| 7750 is resistance |
| 7700 is resistance |
| 7650 is resistance |
| 7600 is support |
| 7570 is support |
| 7550 is support |
| 7500 is support |
Stock Market Outlook for Fri Oct 23 2026
The market giving back the rally of Monday to Wednesday is bearish for stocks but the Dow Jones index continues to suggest the bullish sentiment is alive and well. Normally if this is the start of a more pronounced downturn we should expect the Dow Jones index to be falling sharply along with the S&P and NASDAQ. Instead looking at the SPX numbers, more trades were being placed to the upside on Thursday despite the market ending lower. This too is more bullish than bearish.
Last is the closing candlestick from Thursday which is signaling a bounce is likely in many tech names today.
Overall the outlook is for a choppy day with a strong possibility of a bounce but a flat to lower close should be anticipated.
Potential Economic and Political Market Moving Events
Monday:
10:00 NAHB Housing Market Index for Oct is estimated to slip to 31 from 32 prior – this is bearish
Tuesday:
8:30 Housing Starts were lower than estimated at 1.2 million for Sep
10:00 Pending home sales month over month plunged -7.3% far worse than estimates of -0.4%
Wednesday:
No reports
Thursday:
8:30 Weekly Initial Unemployment Insurance Claims for Oct 17 came in at 197,000 which was lower the estimated
10:00 Leading indicators for Sep came in at 0.0% which is higher than a negative 0.1% estimated
Friday:
9:45 Flash Manufacturing PMI for Oct is estimated at 55.3 down from 57 prior
9:45 Flash Services PMI for October is estimated at 58 down slightly from 58.7 prior