

Prior Trading Day Summary
Tue Oct 20 2026 stocks struggled to continue the rally. By the close the SPX was up 22 points to 7712 and for the week it was up 53 points. This is a recovery of 34% of last week’s loss. This is an excellent sign but a move higher than 50% of the loss is needed to draw in more investors.
The NASDAQ had a poor day with the index down 6 points or basically flat on the day, closing at 26,424 in a choppy session.
Volume on both indexes rose and both also saw more buying than selling as investors cautiously picked through many of the lower stocks. By the close, the S&P saw 67% of all stocks higher and the NASDAQ saw 65% higher.
After hours Netflix earnings disappointed but SpaceX rose on better than estimated earnings results.
Let’s review the closing technical indicators from Tue Oct 20 2026 to see what they predict for Wed Oct 21 2026.
Stock Market Outlook: SPX Closing Chart For Tue Oct 20 2026
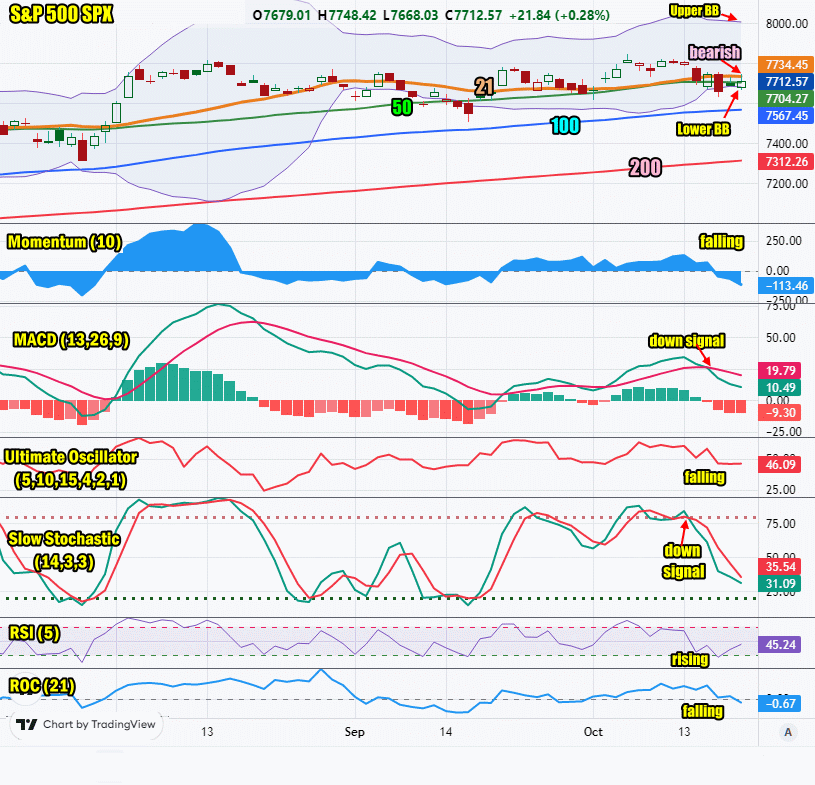
The index ended the day below the Upper Bollinger Band and below the 21 day moving average but at the 50 day. This is still bearish but shows improvement.
The closing candlestick is bearish for Wednesday with a top shadow which often signals dips today could be deeper than anticipated.
The 21 day moving average is falling and closed at 7734. This is bearish.
The 50 day moving average is falling and closed at 7704. This is bearish.
The 100 day moving average is rising and closed at 7567. This is bullish.
The 200 day moving average is rising and closed at 7312. This is bullish.
The Lower Bollinger Band is below the 21 and 50 day moving average and turning lower. This is bullish if it continues to fall. The Upper Bollinger Band is falling which is bearish.
The SPX chart is more bearish than bullish for Wednesday.
SPX Stock Market Outlook review of Tue Oct 20 2026
Stock Market Outlook: Technical Indicators Review
Momentum: Momentum is falling and negative. This is bearish.
|
MACD Histogram: MACD (Moving Averages Convergence / Divergence) issued a down signal on Thu Oct 15 2026. The down signal was stronger on Tue Oct 20 2026.
|
Ultimate Oscillator: The Ultimate Oscillator is falling which is bearish..
|
Slow Stochastic: The Slow Stochastic has a down signal in place and is bearish.
|
Relative Strength Index: The RSI signal is rising which is bullish.
|
| Rate of Change: The rate of change is falling, signaling that Wednesday will end lower. Settings: Rate Of Change is set for a 21 period. This indicator looks back 21 days and compares price action from the past to the present. With the Rate Of Change, prices are rising when signals are positive. Conversely, prices are falling when signals are negative. As an advance rises, the Rate Of Change signal should also rise higher, otherwise the rally is suspect. A decline should see the Rate Of Change fall into negative signals. The more negative the signals the stronger the decline. |
Stock Market Outlook: Support and Resistance Levels |
| 7850 is resistance |
| 7825 is resistance |
| 7800 is resistance |
| 7780 is resistance |
| 7750 is resistance |
| 7700 is resistance |
| 7650 is resistance |
| 7600 is support |
| 7570 is support |
| 7550 is support |
| 7500 is support |
Stock Market Outlook for Wed Oct 21 2026
Earnings from SpaceX were a surprise. This could encourage stocks to move higher on Wednesday. Unfortunately Netflix earnings were disappointing and that won’t help the rally today.
For Wednesday the technical indicators are more beearish than bullish but there is still room for the SPX to push higher if it can recover at least 50% of last week’s loss. There are no economic reports for release today and often that helps stocks.
Potential Economic and Political Market Moving Events
Monday:
10:00 NAHB Housing Market Index for Oct is estimated to slip to 31 from 32 prior – this is bearish
Tuesday:
8:30 Housing Starts were lower than estimated at 1.2 million for Sep
10:00 Pending home sales month over month plunged -7.3% far worse than estimates of -0.4%
Wednesday:
No reports