
Prior Trading Day Summary
On Thu Oct 15 2026 the market became more split with many tech names and in particular semiconductor stocks, falling lower adding to Wednesday’s losses in that sector. Bank stocks as well were largely negative. Many investors moved capital into Dow Jones stocks. Insurance stocks climbed along with transportation and some health care names as investors feel these offer good defense.
The SPX rose 25 points to close at 7744. Volume rose to 6.2 billion shares with 141 new weekly lows and 67 new highs. 72% of all volume was being traded higher and 74% of all stocks closed higher.
The NASDAQ rose 20 points to close at 26,713. Volume jumped to 11.1 billion shares traded. New lows were still high at 530 and new highs were 75. 70% of all volume was being traded higher and by the close 65% of all stocks were rising.
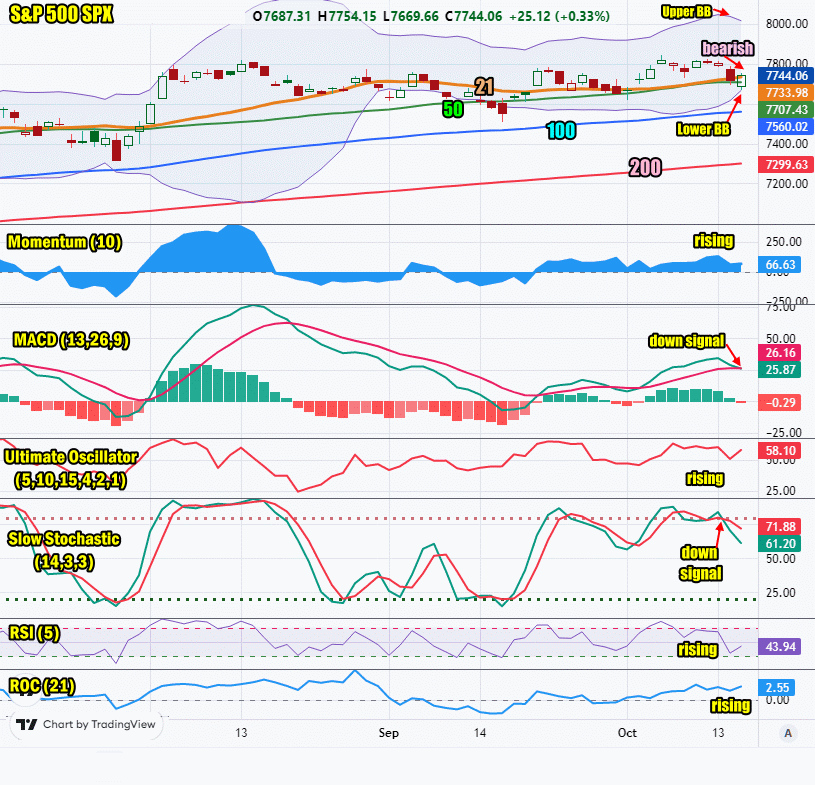
On Thursday the SPX fell below the 21 and 50 day moving average which helped to spark the bounce allowing the index to close just above the 21 day. This though is bearish.
Let’s review the closing technical indicators from Thu Oct 15 2026 to see what they predict for Fri Oct 16 2026.
Stock Market Outlook: SPX Closing Chart For Thu Oct 15 2026
The index ended the day below the Upper Bollinger Band and just above the 21 day moving average. This is bearish.
The closing candlestick is bearish for Friday and the closing shadow indicates a dip back below the 21 and 50 day moving averages is possible.
The 21 day moving average is rising and closed at 7733. This is bullish.
The 50 day moving average is unchanged and closed at 7707. This is bearish.
The 100 day moving average is rising and closed at 7560. This is bullish.
The 200 day moving average is rising and closed at 7299. This is bullish.
The Lower Bollinger Band is just below the 21 and 50 day moving average and rising which is bearish. The Upper Bollinger Band is falling which is bearish.
The SPX chart is more bearish than bullish for Friday.
SPX Stock Market Outlook review of Thu Oct 15 2026
Stock Market Outlook: Technical Indicators Review
Momentum: Momentum is rising and positive. This is bullish.
|
MACD Histogram: MACD (Moving Averages Convergence / Divergence) issued an up signal on Mon Oct 5 2026. The up signal was lost on Thu Oct 15 2026 and a new unconfirmed down signal was generated by the close.
|
Ultimate Oscillator: The Ultimate Oscillator is rising which is bullish.
|
Slow Stochastic: The Slow Stochastic has a down signal in place and is bearish.
|
Relative Strength Index: The RSI signal is rising. This is bullish.
|
| Rate of Change: The rate of change is rising, signaling that Friday will end higher. Settings: Rate Of Change is set for a 21 period. This indicator looks back 21 days and compares price action from the past to the present. With the Rate Of Change, prices are rising when signals are positive. Conversely, prices are falling when signals are negative. As an advance rises, the Rate Of Change signal should also rise higher, otherwise the rally is suspect. A decline should see the Rate Of Change fall into negative signals. The more negative the signals the stronger the decline. |
Stock Market Outlook: Support and Resistance Levels |
| 7850 is resistance |
| 7825 is resistance |
| 7800 is resistance |
| 7780 is resistance |
| 7750 is resistance |
| 7700 is resistance |
| 7650 is resistance |
| 7600 is support |
| 7570 is support |
| 7550 is support |
| 7500 is support |
Stock Market Outlook for Fri Oct 16 2026
Stocks were hit by an increase in the PPI numbers on Thursday that were much stronger than estimated as they come in at 6.3%. This was far higher than estimated. Stocks were already under selling pressure from Wednesday’s sell-off. The PPI numbers added to that uncertainty and stocks spent much of Thursday trying to recover.
For Friday the index has a new unconfirmed MACD down signal. The outlook is negative for Friday and the closing candlestick shows weakness. The jump in volume on Thursday to just over 11 billion shares traded is a positive for the bulls which shows a lot of dip buying was occurring. For Friday the outlook remains poor. The technical indicators are turning negative on the day. The week looks set to end lower.
Potential Economic and Political Market Moving Events
Monday:
No reports
Tuesday:
6:00 NFIB Index of Small Business Optimism for Sep was lower than estimated at 97.9
10:00 Existing home sales for Sep came in as estimated at 4 million
Wednesday:
8:30 Consumer Price Index for Sep rose to 0.6% from 0.4%, higher than estimated
8:30 Core CPI month over monthwas unchanged for Sep coming in at 0.3%
8:30 CPI year-over-year for Sep rose more than estimated to 3.7% from 3.4% prior which sent stocks lower
8:30 Core CPI year over year for Sep rose to 2.6% from 2.4% prior
2:00 Fed’s Beige Book is not expected to point to anything new
Thursday:
8:30 Empire State Manufacturing survey for Oct jumped higher than estimated to 25.5
8:30 Retail sales for Sep were much stronger than estimated coming in at 0.8%
8:30 Weekly Initial Unemployment Insurance Claims for Oct 10 came in at 199,000 pretty much in-line with estimates
8:30 Producer Price Index or PPI for Sep rose far more than estimated to 6.3% which sent stocks lower.
Friday:
8:30 Import Prices for Sep are estimated to rise to 0.8% from 0.7% prior
9:15 Industrial Production month to month for Sep is estimated to rise to 0.4% from 0% prior
9:15 Capacity Utilization for Sep is estimated to rise to 76.5% from 76.3% prior
2:00 Monthly Treasury Balance for Sep is estimated to rise to -29B versus -167B prior