

Prior Trading Day Summary
On Tue Oct 13 2026 bank earnings largely disappointed investors. Most investors were hoping for a blow out quarter but in general bank balance sheets are complex, filled with a wide variety of instruments from loans, lines of credit to mortgages, currency trades and much more. With rising interest rates, many of the banks showed disappointed revenue numbers although in general earnings were good. It was a choppy day of trading but the losses of the day were recovered by the close, a bullish signal.
The SPX lost just 1 points to close at 7805. Volume was4.9 billion shares with new 52 week lows at 179 and new highs at 57. 47% of all volume was being traded higher and 53% of all stocks closed higher.
The NASDAQ fell 41 points to close at 27,204. Volume was higher at 7.2 billion shares traded. New lows rose to 510 and new highs fell to 77. These 52 week lows are more often seen in bearish markets and that remains a concern. 57% of all volume was being traded lower and by the close 60% of all stocks were lower.
Let’s review the closing technical indicators from Tue Oct 13 2026 to see what they predict for Wed Oct 14 2026.
Stock Market Outlook: SPX Closing Chart For Tue Oct 13 2026
The index ended the day below the Upper Bollinger Band but above the 21 day moving average for a seventh straight day. This is bullish.
The closing candlestick is bullish for Wednesday but with shadows top and bottom on the closing candlestick, dips are anticipated.
The 21 day moving average is rising and closed at 7718. This is bullish.
The 50 day moving average is rising and closed at 7707. This is bullish.
The 100 day moving average is rising and closed at 7553. This is bullish.
The 200 day moving average is rising and closed at 7291. This is bullish.
The Lower Bollinger Band is below the 50 day moving average and rising which is bearish. The Upper Bollinger Band is rising which is bullish.
The SPX chart is more bullish that bearish for Wednesday with signals that dips are likely.
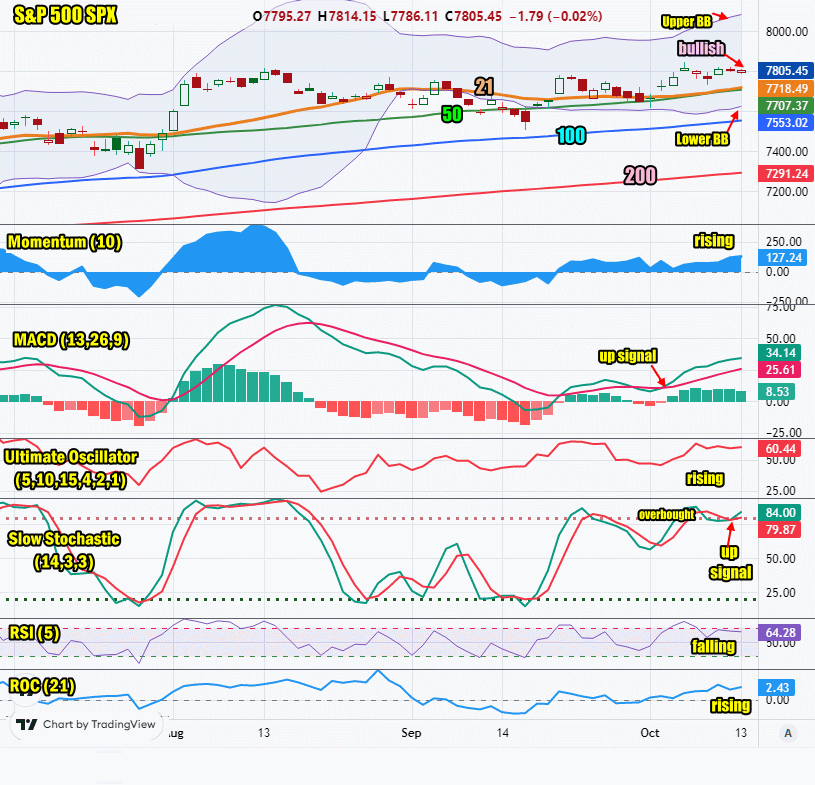
SPX Stock Market Outlook review of Tue Oct 13 2026
Stock Market Outlook: Technical Indicators Review
Momentum: Momentum is rising and positive. This is bullish.
|
MACD Histogram: MACD (Moving Averages Convergence / Divergence) issued an up signal on MonOct 5 2026. The up signal was weaker on Tue Oct 13 2026.
|
Ultimate Oscillator: The Ultimate Oscillator is rising.
|
Slow Stochastic: The Slow Stochastic has a weak up signal in place and is overbought. This is bullish.
|
Relative Strength Index: The RSI signal is falling.
|
| Rate of Change: The rate of change is rising, signaling that Wednesday will end higher. Settings: Rate Of Change is set for a 21 period. This indicator looks back 21 days and compares price action from the past to the present. With the Rate Of Change, prices are rising when signals are positive. Conversely, prices are falling when signals are negative. As an advance rises, the Rate Of Change signal should also rise higher, otherwise the rally is suspect. A decline should see the Rate Of Change fall into negative signals. The more negative the signals the stronger the decline. |
Stock Market Outlook: Support and Resistance Levels |
| 7850 is resistance |
| 7825 is resistance |
| 7800 is resistance |
| 7780 is resistance |
| 7750 is resistance |
| 7700 is resistance |
| 7650 is resistance |
| 7600 is support |
| 7570 is support |
| 7550 is support |
| 7500 is support |
Stock Market Outlook for Wed Oct 14 2026
On Wed Oct 14 2026 we get more bank earnings but news after hours of a huge $1.2 billion settlement by Bank Of America (BAC) with the Treasury Department after failing to have proper safeguards in place and failure to report suspicious activity will weigh on the banking sector at the open. Bank earnings on Tuesday were rather ho-hum and that was met by some selling. The indexes managed to regain their footing in the late afternoon and recovered almost all the losses from early in the day but without strong bank earnings investors will be looking elsewhere for a trigger to send stocks higher. Meanwhile the technical indicators are showing a bit more weakness for today and that could mean a lower day. Overall though stocks remain bullish but there are further signals advising to stay cautious.
On Wednesday we get the latest Consumer Price Index (CPI) numbers which can show inflationary pressures. These should be watched tomorrow morning.
Potential Economic and Political Market Moving Events
Monday:
No reports
Tuesday:
6:00 NFIB Index of Small Business Optimism for Sep was lower than estimated at 97.9
10:00 Existing home sales for Sep came in as estimated at 4 million
Wednesday:
8:30 Consumer Price Index for Sep is estimated to rise to 0.6% from 0.4% prior
8:30 Core CPI month over month is estimated to drop to 0.2% for 0.3% prior
8:30 CPI year-over-year for Sep is estimated to rise to 3.6% from 3.4% prior
8:30 Core CPI year over year for Sep is estimated to rise 2.5% from 2.4% prior
2:00 Fed’s Beige Book is not expected to point to anything new
2:00 Monthly Treasury Balance for Sep is estimated to rose to -29B versus -167B prior