
The outlook for Thursday was for a lower day. Early morning the futures showed a large drop to start the day but instead when markets opened, they climbed. The rally lasted until mid-way through the lunch hour. Once the SPX moved negatives it never recovered. The day ended with a loss of 23 points or half a percent. The S&P closed at 4326 and is now down 10.2% from its 52 week high.
The NASDAQ lost 189 points for a loss of 1.4% as stocks like Intel were pushed lower. The day ended with the NASDAQ at 13352.78. The index closed down 17.6% from its 52 week high.
Let’s review Thursday’s close to see what Friday will look like for stocks.
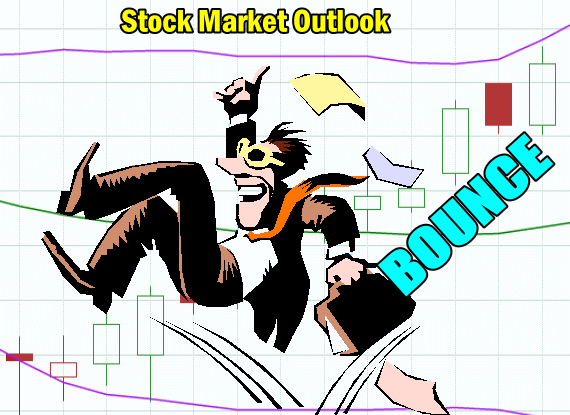
Stock Market Outlook Chart Comments At The Close on Thu Jan 27 2022
The closing candlestick on Thursday is bearish but the index traded all day inside the Lower Bollinger Band which is bullish. The candlestick is advising that a bounce should be expect for Friday.
The Upper Bollinger Band is turning sideways which at this point is bearish. The Lower Bollinger Band is falling, which at present is bearish.
The 21 day moving average is still below the 50 day moving average continuing that down signal.
The 100 day is falling which is bearish. The 200 day moving average is is turning sideways which is neutral.
The chart is very bearish and the index closed below the 200 day moving average for a third day. Often a third close below the 200 day but still above the initial plunge low on Monday also advises a bounce is coming. The remaining technical indicators are in agreement for a bounce on Friday.

Stock Market Outlook review of Thu Jan 27 2022
Stock Market Outlook: Technical Indicators Review:
Momentum: Momentum is falling and is negative. It is still signaling oversold and a bounce higher is expected.
- Settings: For momentum I use a 10 period when studying market direction.
MACD Histogram: MACD (Moving Averages Convergence / Divergence) issued a down signal on Thursday Jan 6. On Thursday the down signal was strong but pulled up a bit from prior readings. It ended the day at minus 35.28. The MACD histogram is at a point where we often can expect a large bounce.
- Settings: For MACD Histogram, I am using the Fast Points set at 13, Slow Points at 26 and Smoothing at 9.
Ultimate Oscillator: The Ultimate Oscillator is unchanged and after 3 days of not falling lower, we should expect a move higher.
- Settings: The Ultimate Oscillator settings are: Period 1 is 5, Period 2 is 10, Period 3 is 15, Factor 1 is 4, Factor 2 is 2 and Factor 3 is 1. These are not the default settings but are the settings I use with the S&P 500 chart set for 1 to 3 months.
Slow Stochastic: The Slow Stochastic has a neutral signal in place and is just out of oversold readings. I would expect a higher day on Friday.
Settings: For the Slow Stochastic I use the K period of 14 and D period of 3. The Slow Stochastic tries to predict the market direction further out than just one day.
Relative Strength Index: The RSI signal is falling and very oversold. It is reaching levels where a bounce back should be expected at any time.
- Settings: The relative strength index is set for a period of 5 which gives it 5 days of market movement to monitor. It is often the first indicator to show an overbought or oversold signal.
Rate of Change: The rate of change signal is unchanged which advises that prices shouldn’t be dropping on Friday.
- Settings: Rate Of Change is set for a 21 period. This indicator looks back 21 days and compares price action from the past to the present. With the Rate Of Change, prices are rising when signals are positive. Conversely, prices are falling when signals are negative. As an advance rises the Rate Of Change signal should also rise higher, otherwise the rally is suspect. A decline should see the Rate Of Change fall into negative signals. The more negative the signals the stronger the decline.
Support and Resistance Levels To Be Aware Of:
4800 is resistance
4725 is resistance
4700 is resistance
4670 is resistance
4655 is light support.
4600 is good support
4550 is light support
4525 is light support
4500 is support
4490 is light support
4475 is light support
4450 is support
4400 is good support and the 200 day moving average
4370 is light support
4350 is light support
4300 is good support
4290 is light support
4270 is light support
4250 is good support
4225 is light support
4200 is good support
Stock Market Outlook for Tomorrow – Fri Jan 28 2022
As you can see from the technical indicators and their signals, they are supporting the SPX chart pattern outlook for a bounce. This is not an all-clear signal, but each day the technical readings have not worsen but instead shown slight improvements daily. Now they are all advising the market will move higher on Friday.
Investors should expect a large bounce on Friday. There will be selling, especially once the bounce stalls out but a move above 4400 is expected which will leave the S&P back above the 200 day moving average heading into the weekend.
As well, Apple’s earnings beat all analysts estimates and forward guidance was above estimates. This will add strength to the rally on Friday.
I will be buying SPY calls and the TQQQ on Friday morning. Details will be posted in the morning Investing Strategy Notes for members.
Stock Market Outlook Archives
Stock Market Outlook for Fri May 3 2024 – All About The April Non-Farm Payroll Report

Morning Investing Strategy Notes for Thu May 2 2024

Stock Market Outlook for Thu May 2 2024 – Potential Bounce But Lower

Morning Investing Strategy Notes for Wed May 1 2024
Stock Market Outlook for Wed May 1 2024 – Bounce But Lower – Fed Interest Rate Decision

Morning Investing Strategy Notes for Tue Apr 30 2024
Stock Market Outlook for Tue Apr 30 2024 – Dips Likely – Flat To Higher Close

Morning Investing Strategy Notes for Mon Apr 29 2024
Stock Market Outlook for Mon Apr 29 2024 – Some Weakness But Higher

Morning Investing Strategy Notes for Fri Apr 26 2024
Stock Market Outlook for Fri Apr 26 2024 – Higher and Positive Close

Morning Investing Strategy Notes for Thu Apr 25 2024
Stock Market Outlook for Thu Apr 25 2024 – Weakness and Lower

Morning Investing Strategy Notes for Wed Apr 24 2024
Stock Market Outlook for Wed Apr 24 2024 – Some Weakness But Higher Close
