
Thursday Dec 26 saw stocks advance on a reasonably broad front but on low volume due to many investors still away for the Christmas Holiday.
With Thursday being Boxing Day, volumes were well below average on the exchanges. Despite this, stocks rose to new all-time highs with the S&P within 10 points of reaching 3250 and the NASDAQ closing above 9000 for the first time.
Stock Market Outlook Chart Comments At The Close on Thu Dec 26 2019
The SPX chart continues to be bullish. The closing candlestick on Thursday was bullish for Friday although it did dip inside the Upper Bollinger Band which often signals some weakness should be expected.
The Upper Bollinger Band however is still rising. The Lower Bollinger Band is moving sideways which, if it turns back up will be bullish.
All the major moving averages are still climbing and there are three support levels in place. 3100 and 3075 are both light support with better support down at 3000, which is 7.4% below Thursday’s close and would mark a normal correction in a bull market should we get a 5% to 7% correction in January.

Stock Market Outlook review of Thu Dec 26 2019
Stock Market Outlook: Technical Indicators Review:
Momentum: Momentum is positive and rising.
- Settings: For momentum I use a 10 period when studying market direction.
MACD Histogram: MACD (Moving Averages Convergence / Divergence) issued an up signal on Friday Dec 13. On Thu Dec 26, the up signal was stronger again.
- Settings: For MACD Histogram, I am using the Fast Points set at 13, Slow Points at 26 and Smoothing at 9.
Ultimate Oscillator: The Ultimate Oscillator signal is rising and signaling the market is overbought.
- Settings: The Ultimate Oscillator settings are: Period 1 is 5, Period 2 is 10, Period 3 is 15, Factor 1 is 4, Factor 2 is 2 and Factor 3 is 1. These are not the default settings but are the settings I use with the S&P 500 chart set for 1 to 3 months.
Slow Stochastic: The Slow Stochastic is extremely overbought and has a weak up signal in place.
- Settings: For the Slow Stochastic I use the K period of 14 and D period of 3. The Slow Stochastic tries to predict the market direction further out than just one day.
Relative Strength Index: The RSI signal is rising and signaling very overbought.
- Settings: The relative strength index is set for a period of 5 which gives it 5 days of market movement to monitor. It is often the first indicator to show an overbought or oversold signal.
Rate of Change: The rate of change signal is falling lower.
- Settings: Rate Of Change is set for a 21 period. This indicator looks back 21 days and compares price action from the past to the present. With the Rate Of Change, prices are rising when signals are positive. Conversely, prices are falling when signals are negative. As an advance rises the Rate Of Change signal should also rise higher, otherwise the rally is suspect. A decline should see the Rate Of Change fall into negative signals. The more negative the signals the stronger the decline.
Support and Resistance Levels To Be Aware Of:
3200 is resistance
3100 is light support
3075 is light support
3030 is light support
3000 is support
2960 is light support
2950 was light support
2900 is light support
2860 is light support
2840 is support
2800 is strong support
2795 is light support
2745 to 2750 is light support
2725 is light support
2700 is light support
Stock Market Outlook for Tomorrow – Dec 27 2019
The technical indicators are continuing to flash strong overbought signals. The Rate Of Change is the biggest concern as it is turning back down despite the market advancing. Often this signals a change in prices should be expected.
Friday though looks like it could start strong and end with new closing highs again. Monday however could see the overbought and rate of change signals turn into a negative day or even two.
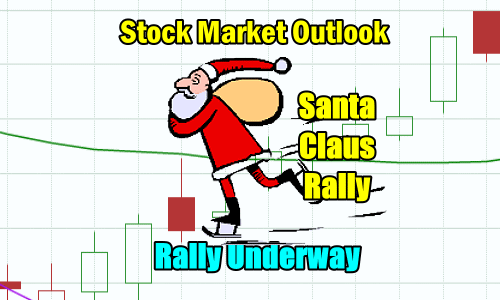
The Santa Claus Rally is underway. The original goal for the end of the year was 3250 and within the index now within 10 points, we should see more profit-taking and higher volumes on Friday.
That means that with the Santa Claus Rally underway, we should see a higher close on Friday but there will be some selling to contend with which might mean the close of the day could be only slightly higher.
Stock Market Outlook Archives
Stock Market Outlook for Thu May 2 2024 – Potential Bounce But Lower

Morning Investing Strategy Notes for Wed May 1 2024

Stock Market Outlook for Wed May 1 2024 – Bounce But Lower – Fed Interest Rate Decision

Morning Investing Strategy Notes for Tue Apr 30 2024
Stock Market Outlook for Tue Apr 30 2024 – Dips Likely – Flat To Higher Close

Morning Investing Strategy Notes for Mon Apr 29 2024
Stock Market Outlook for Mon Apr 29 2024 – Some Weakness But Higher

Morning Investing Strategy Notes for Fri Apr 26 2024
Stock Market Outlook for Fri Apr 26 2024 – Higher and Positive Close

Morning Investing Strategy Notes for Thu Apr 25 2024
Stock Market Outlook for Thu Apr 25 2024 – Weakness and Lower

Morning Investing Strategy Notes for Wed Apr 24 2024
Stock Market Outlook for Wed Apr 24 2024 – Some Weakness But Higher Close

Morning Investing Strategy Notes for Tue Apr 23 2024
Stock Market Outlook for Tue Apr 23 2024 – Bounce But Lower