
Market timing certainly isn’t a science but often the market timing indicators are so clear that it simply cannot be refuted. The market timing indicators for weeks have been flashing overbought signals. Indeed many analysts talked about the overbought condition but felt that strength of the market would see a 2% correction at best before the rally continues. Indeed more and more analysts are calling for the S&P 500 to easily reach 1700 this year and the Dow to quickly pass 14,000. A handful see the Dow at 17,000 by next year.
They might be right and it would be nice if they were. It would even be nicer if the markets were that high because earnings pushed them that high and not because a stock bubble was created caused by low interest rates because everyone knows how that will end. This week has been a clear indication of an extreme overbought condition and right now my market timing indicators are confirming today’s bounce but indicate there is more room for selling in the days ahead.
Market Timing Indicators Still Show 5% Decline
A couple of weeks ago I bought spy puts because the market was very overbought and my technical indicators were flashing a warning that the market was so overbought that a correction of 3% to 5% was in order. At that time I indicated that I believed the S&P 500 could fall to around 1300 without much difficulty. That would mark a normal 5% correction in an ongoing bull market and that is what I am still looking for.
While not a market timing indicator, I do enjoy the Trader’s Almanac. According to the Trader’s Almanac March has been a historically strong month early and then market direction changes to down. It is April that historically is the best month of the year and has been since 1950. If history is any guide March market direction should be sideways to down but no more than 5%. Then April should see the market direction change back to up. After that it could be another situation of sell in May and go away.
Therefore many investors who believe this scenario will be cautious in March and probably do some selling. A recent article I read indicated that many fund managers are trimming their stock holdings because they are up over 10% since Christmas and that normally marks the type of return where they raise cash as they want to be ready for the slow summer period which often sees lower stock prices.
Market Direction Chart For March 6 2012
Below is the market direction chart for March 6 2012. You can see the past three trading sessions are down and today was the largest decline for 2012. Because there has not been a significant correction since December the talking heads on television will be talking up a storm bring all the doom and gloom back to the market, but this does not yet look anything like a market top. If you recall my short article on spotting a market top, this is not a top yet. You can read that article through this link. You have to scroll down the page a bit to find it.
The chart below shows what I am looking for. The market could easily pullback to 1300 which marks the top of Oct 27 2011 when the market reached 1292.66. If the market direction should not change and the S&P 500 fall below 1300, I believe the market could fall another 3% to around 1250.
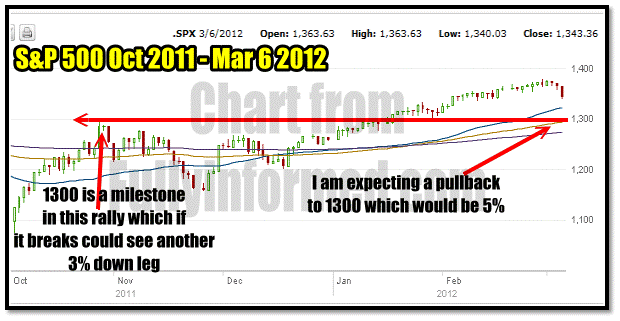
I am expecting a 5% correction which would mean a drop to 1300 in the S&P 500
Market Timing / Market Direction Indicators For March 6 and 7
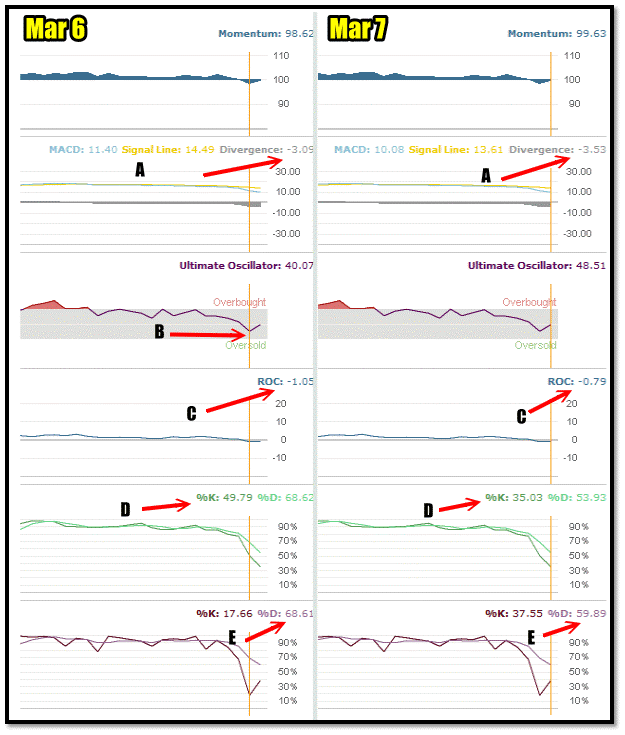
Below are two charts. One from March 6 and the other from March 7. These are my market timing and market direction indicators. I have marked what I consider to be the most important market timing readings for yesterday and today, which to me clearly show that the market direction will return to down. This correction is not over.
- MACD (Moving Average Convergence / Divergence) is LOWER today than yesterday indicating that today was merely a bounce.
- While the Ultimate Oscillator reading is better today there was plenty of room for the Ultimate Oscillator to fall further yesterday. There is still a lot of room before an oversold indication which should mark a good bounce. Today was just a rebound from such heavy selling yesterday.
- Rate Of Change remains decidedly negative.
- Slow Stochastic reading is LOWER today than yesterday despite today’s rebound.
- The Fast Stochastic %D reading is lower today than yesterday again indicating no strength in the buying, just a rebound.
With this many market timing indicators pointing down, the market direction has not shifted and there is more selling ahead. Because of today’s readings I bought SPY PUTS at the close. I am holding 20 SPY PUTS April 21 at $135 which I bought for $2.96.
Market Timing / Market Direction Summary For March 7 2012
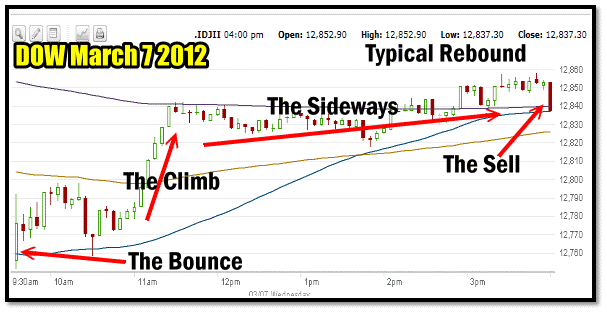
Finally, one last image to leave you with. Here is the Dow Jones for the Day. There is the typical opening bounce then the climb and then basically sideways for the rest of the day until the close when the selling hit the market at the end. This is typical of traders who suspect this was merely a bounce. A day like yesterday where the market fell more than 200 points will have more than just the one sell off in it. There is definitely more selling ahead.
My market timing indicators are giving me a clear message which is easy to spot. Today was a bounce, more selling is coming up. There should be some great opportunities for put selling ahead.