
It comes down to Good News and Bad News. One day the news looks bad and the next day the news looks good. Yesterday the news looked bad and today the economic news looks good. All the stocks markets moved higher today and the S&P 500 today closed near the high for the day ar 1358.04. Buying commenced in the morning and last all day. Does this mean that the market direction is finally confirmed as still moving higher?
Market Timing Indicators For Feb 16 2011
Below are the market timing indicators for today on the S&P 500.
Despite the book jump today the market timing indicators have not budged a great deal. Momentum is up slightly over yesterday but that would be expected. MACD (Moving Average Convergence / Divergence) is now negative 0.50 versus yesterday’s negative 0.73.
The Ultimate Oscillator is up to 67.15 but two days earlier it was at 72.59. The Ultimate Oscillator I have found to be among the best of market timing tools and today with the rally it is warning that the rally was nice but it didn’t break the readings of Tuesday. Instead it is telling investors that there has to be follow through on these rallies in order for the trend to be confirmed as continuing higher just as there has to be follow through on down days to confirm that the market direction uptrend is broken to the downside and that also has not happened.
The Rate of Change for today actually moved lower at 0.98 versus yesterday’s 1.33 so it too is telling investors to wait for follow through before committing capital.
The slow stochastic market timing tool is pretty well unchanged while the fast stochastic the final market timing tool at the bottom of the chart is up from yesterday and shows that there should be follow through tomorrow which if it occurs will confirm the market direction and continuing up.
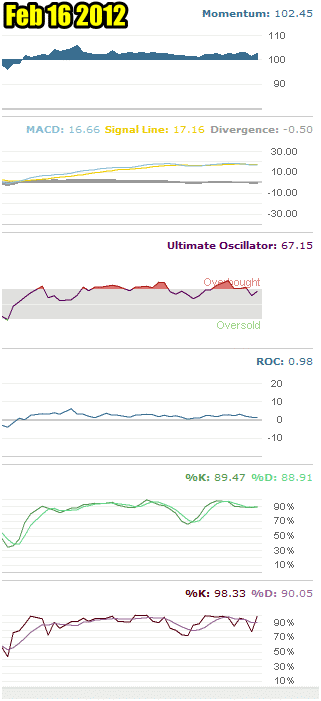
Market Timing / Market Direction Indicators for Feb 16 2012
The market has been on edge since the start of February. It wants to move higher but the Euro debt news has investors worried. With the market at lofty heights no investor wants to commit capital only to find out that the Greek deal falls apart and the market tumbles 10%. But like all investors they also fear missing the rally higher and so they sit stuck in this see-saw battle of good news and bad news.
You must understand that investors don’t care about Greece they just want something concrete to end the waiting so the market direction can move up or down. They don’t even care if the deal is bad and 8 years from now Greece is a total mess. Actually they don’t care if Greece is worse in a year’s time. Investors just want it out-of-the-way for now so the market can continue to move higher.
Market Outlook For The S&P 500
The Dow Stock Market has now set a new high for the past 52 weeks and the NASDAQ has set a new high for the past 10 years. When will the S&P 500 follow them? The S&P 500 is just 12.54 away from the May 2 2011 high.
The all time high in the S&P 500 was in Oct 11 2007 when the S&P 500 reached 1576.09. The S&P 500 is just 218.05 away from that high. A pretty spectacular recovery from the doom and gloom of 2008 to 2009 when the world was ending.
The market timing indicators above remain divided on the outcome of the next couple of days and perhaps that should be the case considering that February is the weakest month of the spring period. If this is the case and the market pushes higher in the next week or two there could always be the possibility that the S&P 500 could reach and maybe break the 2007 all time high. That would be pretty amazing considering all the issues being faced by the world’s economies today.
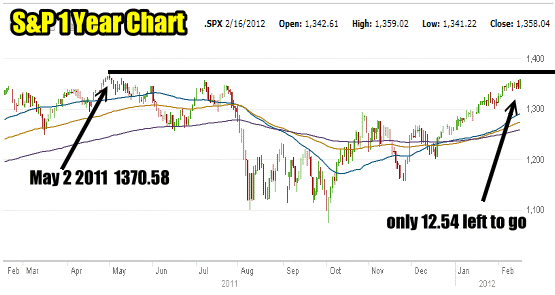
Market Timing / Market Direction S&P 500 1 Year Chart
For Those Who Worry
Finally, for those who worry about a new market top, here is how to spot a market top. This chart is from the S&P 500 market top of 2007.
A) Mid July 2007 the market made a new high of 1555.90
B) Early Oct 2007 the market made a new higher high of 1576.09
C) Mid December 2007 the market made a lower high of 1523.57
D) In August 2007 the market set a low of 1370.60 which it broke in mid January 2008.
E) The market then made a new lower low by mid-March 2008 of 1256.98. This mid-March low was seen by most analysts as the end of the 2007 to 2008 bear market and most called for the S&P 500 to resume to challenge the high (B).
F) As the market climbed many investors bought into the rally but by mid-May 2008 the market topped out at 1425.82 and the bear market had trapped a lot of investors.
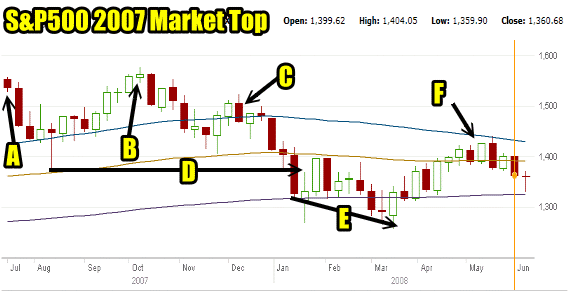
How To Spot A Market Top
Spotting a market top is actually a lot easier than it looks. Just watch for the above classic signs and buy market puts or buy ultra bear funds when the market fails to make a new high. That’s the course of action I did in 2007 and I held my Ultra 2X Bear fund until November 2008. At that point I was back selling puts which as it turns out was not the right time to be selling puts as the market moved lower into March 2009.
My Ongoing Spy Put Trade
For those who are following my on again off again and on again Spy Put Trade, I didn’t close any of my spy put contracts. I am willing to risk losing the $700 profit I made from the original Spy Put Trade as I want a little bit more security going into options expiration tomorrow.
Market Timing / Market Direction Summary
Market timing is not a science but it does hold a lot of credit for my profits over the years. I would though be the first to tell you that it has made lots of mistakes and as have I. Tomorrow I won’t be at all surprised to find out that I should have sold my 10 SPY PUT contracts today but without solid confirmation from my market timing indicators that the market direction has truly not stalled, I want to hold them a little bit longer because perhaps tomorrow it will be “bad news”.
You can review the SPY PUT Trade here.