Market Direction today was nice to see. The market thrashed about as it drifted back and forth between gains and losses and finally ended with a small gain. Today’s stock action could be a significant event for this week. Yesterday the market direction was down and then stocks recovered. It was not a great recovery but the bounce is what was important. My market timing column yesterday still showed too many negatives to get excited about a bounce, but the move down and then back up is what gave me the clue to put some capital to work selling puts.
I didn’t use a lot of capital, but some capital as often a 10% correction will see support and some buying. Usually this buying will last a few days and for many of the naked puts I sold I only need a few days respite from selling to turn in good profits. I can then close the trades and go back to cash and wait for another clear market timing signal for market direction.
Market Direction By Candlesticks
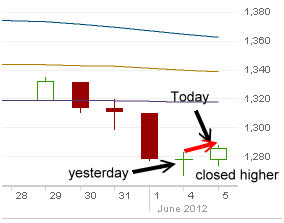
Once in a while I mention candlesticks. While I am not a big follower of candlestick market timing, it has its place like all market timing systems. Yesterday’s Candlestick indicated the possibility that the market direction was reverse back up. Today’s candlestick known as a White Candlestick opened lower but closed higher than the previous day’s candlestick. This confirms yesterday’s candlestick and has given a buy signal on the S&P 500.

Many investors follow candlestick market timing like a religion, to invest against market direction.
Personally though I like more confirmation than candlestick market timing can provide.
S&P 500 Market Timing Indicators For June 5 2012
My market timing indicators on the S&P 500 are mixed from yesterday but then I would expect that to be the case after today’s stock action.
There are some interesting market timing technical readings that are worth mentioning as we discuss market direction.
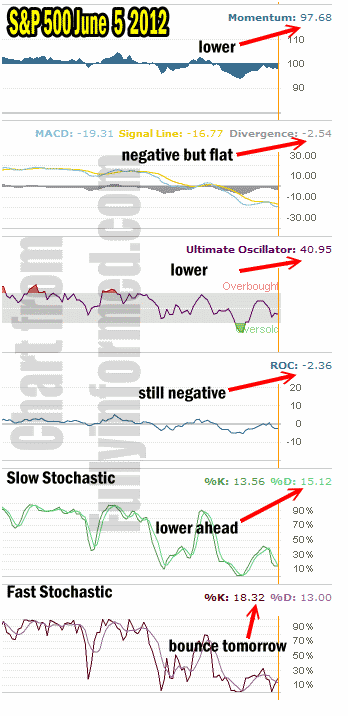
Momentum is actually lower today than yesterday. One of the more unique market timing tools, MACD is still negative with hardly any change today from yesterday.
The Ultimate Oscillator today has turned back lower from yesterday. The rate of change market timing indicator has improved slightly but is still negative.
The most interesting market timing tools are the slow stochastic and fast stochastic. Just to review, the slow stochastic looks out beyond a day or two while the fast stochastic is a day or two at most. The fast stochastic has issued a buy signal during the day today while the slow stochastic is still indicating more selling ahead.

Market timing indicators for June 5 are mixed which reflects the state of the S&P 500
IWM Market Timing Indicators For June 5 2012
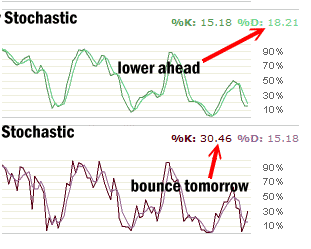
Some times it can help understand market direction by looking at other indexes, however the Dow and NASDAQ Indexes both reflect the same level of indecision as the S&P market timing indicators. I therefore looked at the Russell 2000 small cap which often reflects significant changes before the S&P 500.
However almost all the readings were the same except for the fast stochastic which has a reading of %K 30.46 which should translate into a large up move either today or tomorrow.

Market Direction as indicated by IWM Market Timing shows a mixed picture of up short-term and down within a few days
Market Direction and the 200 Day Moving Average
The problem for the markets is the 200 day moving average which all the markets have fallen through. The NASDAQ probably has the best chance of breaking back through the 200 day moving average. However the S&P 500 will have more trouble. What I am expecting is that the S&P 500 may be able to rally for a day or two more and might even brush the 1300 level. However I would expect a move back down to retest the 1266 level again.
Market Direction Outlook for June 5 2012
If the market direction can push through 1300 and hold then we may see a summer rally. If however the S&P 500 should be unable to hold the 1300 I would expect it to fall back to around 1266, test support and then commence a summer rally. Should 1266 break, then the market will probably fall to the next level of support at 1250.
Don’t Short Here
Don’t short this market at this stage of the correction. The market direction is now going to enter pivotal points in direction. There is a good chance the rally can push to 1300 which is where I would expect resistance to step up and push the market back to do the retest I discussed. If the market direction stays positive and the S&P 500 gets to 1300, a reassessment will have to be made at that time to determine whether SPY puts should be bought against the market. My personal outlook is the market will rally to around 1300 and then fall back to 1266. The only unknown entity at this point remains Europe.
Market Direction Conclusion
The market remains mixed but the bias is to the upside for a couple of days. Then I would expect a retest of 1266 to start.
The Walgreens stock trade articles are designed for the market we are presently in. If the market moves lower the trade strategies should still work out. If it moves higher they should also work out. Walgreens stock is sitting close to the lows last seen in 2010. There is a lot of support at this level.
My article about put selling at the 10% correction level is indicative of what I would expect. When the market corrects 10% and falls below the 200 day normally there is a period of strong selling as it falls below the 200 day. This is typical as many investors including institutional, trade out at the 200 day. Then selling slows, the market usually turns sideways and should get a bounce from an extreme oversold condition, which the market was in. We have seen all of this occur. Big down day at the 200 day, lots of selling as it fell through the 200 day and then the inevitable slowing of selling and bounce.
Today saw not much of a bounce, but the move off the lows, just like yesterday, show there are buyers lurking here at 10%. That’s why I sold my puts here. I believe we will see a bounce maybe even as high as the 1300. At that point I believe the market will retest 1266. But that’s a guess at this point and the market direction will have to be reassessed as the market moves higher.
Covering naked puts if they are out of the money is probably not necessary because the market was very oversold particularly on Friday.
These are classic signs that should help any investor. Big down days like Friday if they have no follow through, tell you that the market has exhausted sellers for the moment. Friday was the big down day. Monday saw the market sell lower and come right back and on lighter volume than Friday. That’s the clue, the bounce back. In my market timing comment on Monday I indicated that it wasn’t the rally that was important but the bounce back.
Same thing happened again today. When you look at volume you can see that it is a lot lower than Friday. This is typical. Down 10% and then sideways while the market digests what has happened and how much damage has been done. However covering your naked puts is a good option if you want the cash to play the move back up. I suppose you could buy calls for the bounce up and then look at the technicals as the S&P 500 reaches for 1300, to see whether or not the market is going to retest the 1266 which is what I expect.
Leaving Europe out of the equation, the market should have a bounce here but if Europe comes back in to the equation the bounce may not last long. I am though not looking for a bear market return this summer. In my article on the market feeling like a bear, I indicated that it is not a bear market and I don’t expect one. I still think the market was way ahead of itself and was looking for a reason to sell.
It’s an election year and I doubt we will see a return to a bear market this year. When selling puts it is important to remember that markets never go straight down just as they never go straight up. Keep watching the technicals while market direction falls lower and look for the inevitable bounce as the market direction heads into extreme oversold territory. That’s the clue that market direction is probably going to change to back up even if for just a few days.
