
Market Direction had a bit of a reprieve today and indeed the recovery from the day’s lows was nice to see. This helped push up a couple of market timing indicators but overall the pressure to the downside remains.
Market timing is used not just to predict tomorrow’s market direction, but in a downturn such as we are experiencing, it is also used to look out beyond a couple of days. With the nice rally back from today’s lows we could see a bit of rally from here but remember that after Friday’s huge down move a bit of a bounce should have been expected. Perhaps even a couple of days of a move higher may occur, but overall the purpose of market timing is to stay on the right side of the market direction. Right now that direction is lower, so if a rally ensues I watch my timing indicators to tell me when that rally is ending, to put in place more spy put options.
With factory orders down, housing still not reaching a bottom, unemployment edging higher and all the Euro problems, investors are clinging to the belief there will be a quantitative easing number 3 very soon. In fact with elections in the fall, Bernanke may wait until late summer before doing anything major. Indeed if Europe should come even close to getting their act together we could see a major rally for at least a few days to possibly weeks.
Market Direction Yardstick
But I cannot invest based on what if’s or even whether there will or won’t be a QE3. I have to invest with what I see presently and with the 200 day moving average broken I would expect the S&P 500 to fall at least another 2% from today’s close sometime soon. In 2010 the S&P 500 fell 17 percent in a correction. In 2011 the S&P 500 fell 21% from its late April high.
If we use both of these declines as a yardstick a 12% correction this time around is certainly not out of the question. Overall I would think 15% is a real possibility. 15% from the April 2 2012 high would place the S&P 500 around 1200 which is I believe quite possible.
Market Timing and the VIX Index
The VIX Index as many investors know, measures the volatility within the stock market. Basically it is nicknamed the fear factor. When volatility rises it is almost always caused by investors dumping and fleeing stocks. This correction though has not seen a dramatic rise in the VIX Index. The chart below shows the past two serious market corrections of 2010 and 2011. Almost from the outset the VIX Index jumped in both those corrections. In the present correction it has not. Still with the S&P 500 now down 10%, the VIX is nowhere near as high as previous 10% corrections.
This seems to indicate that many investors remain wary but not deeply concerned about this market correction. Could it be that the whisper of QE3 is keeping a floor under investors?
This should be a concern of investors. If the selling was ending, the VIX should be a lot higher. Even with today’s little rise to 27.73, the VIX Index is a long way away from the 40 and 50 readings of the previous two corrections. This tells me there is probably more selling ahead.
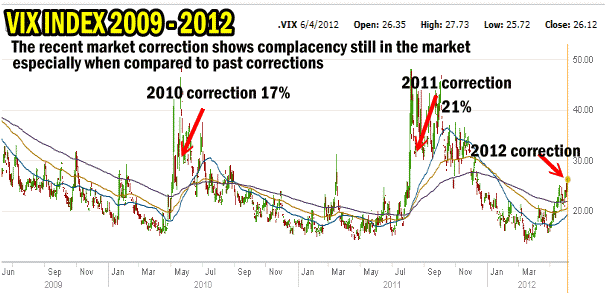
Market Timing Using The VIX Index shows a high degree of complacency still in this correction
Market Timing Indicators For June 4 2012
Below are today’s market timing indicators predicting market direction. There are a number of indicators worthy of consideration.
Momentum is up slightly from yesterday. MACD (Moving Average Convergence / Divergence) however, one of the best market timing indicators is moving lower and with the divergence widening, it is predicting more selling ahead.
The Ultimate Oscillator is up slightly but nowhere near oversold territory so there is plenty of room for the market to fall further.
Despite today’s nice rally back, the rate of change market timing technical indicator shows market direction is down.
Finally the slow stochastic and fast stochastic are both indicating there is more selling ahead. Both show that the S&P 500 is still under pressure from sellers.
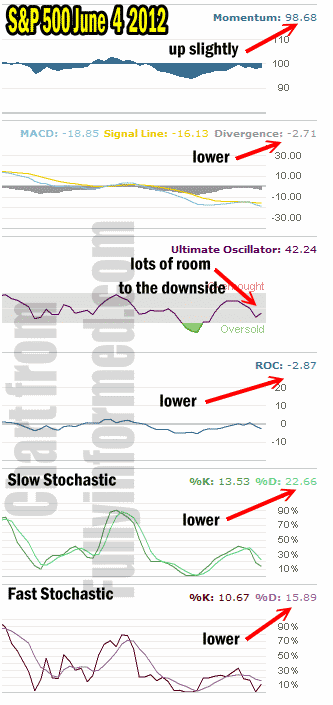
Market direction based on the above market timing indicators is a firm down call.
Market Direction / Market Timing Outlook for June 4 2012
The slow and fast stochastic are probably the most concerning at this stage in the correction. Both show that short-term and mid-term more selling is ahead. The VIX Index readings should be a warning to investors that complacency still is in the market despite the 10% drop in valuations.
Overall my market direction outlook is we could see a bit of a bounce which could last even longer than one day but if it doesn’t occur I won’t be surprised because the market timing indicators are almost unanimous that the market direction is lower still.