
Market Direction on Friday was down and then down. My support levels from Friday Market Direction article certainly seems to have hit the spot as it were. The S&P is almost at my first level of support 1275. All this in one day! When I had mentioned in an article earlier this month about the possibility of the S%P 500 falling to 1275, a full 10% lower, I received a lot of emails from readers telling me they would be in there buying like mad if stocks got that low. I wonder how many were buying on Friday. It certainly looks like most investors went to the sidelines as market direction fell rapidly.
With the S&P 500 down 2.46%, the entire day was, for want of a better word, bearish.
When stocks are rising everyone talks about buying them if only they were cheaper. Well now they are, but the buyers have disappeared. It’s always the same story. Stocks are expensive, investors buy. Stocks become cheaper, investors run away. I wonder how investors figure stocks are going to get cheaper if not through selling?
Official Bear Market Territory
The official bear market signal is a 20 percent correction in market direction which would place the S&P 500 down 284.48 from its intra-day high of 1422.38 of April 2. That would mean the S&P 500 has to reach 1137.90 to officially be in a bear market. That would put the S&P at levels seen in October 2011 and is far below Friday’s close of 1278.04.For that to happen market direction is going to have to stay bearish.
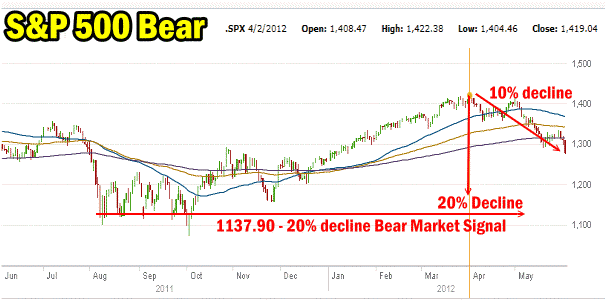
So far the decline is 10% on the S&P 500. The market direction is half way to a bear market.
Bear Market – Halfway There
The question a lot of investors are asking now is whether the market is on the verge of entering a new bear market. It would be nice to know whether or not the markets are about to enter a new bear market now, rather than waiting to see if the markets can fall another 10% and then declare the bear market has arrived.
I for one would prefer to know in advance if things are really going to get nasty from here. While we might not be in a bear market right now, the correction has become severe enough that it already feels like a bear market and certainly sentiment is incredibly bearish which is often a good sign that perhaps the selling may slow and market direction change to neutral from bearish.
Yale’s Crash Confidence Index
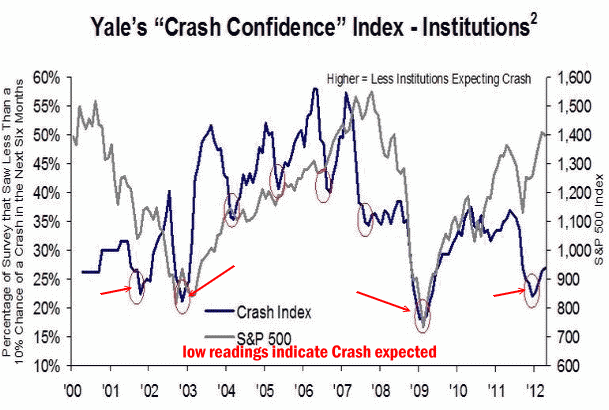
Yale Crash Confidence Index Chart To June 2012 shows bearishness is extremely high
The Yale’s Crash Confidence Index has taken quite the tumble and is now at readings that are as low as the bottom of the 2003 bear market. From that point forward the Stock Market rallied for 3 years before any sizeable correction.
But while the Yale Crash Confidence Index might give cause for some investors to believe the worst selling is behind, it is important to realize that sentiment is extremely bearish because there are so many problems facing the global economies.
Presently most blue chip, large cap businesses are enjoying good earnings and solid profits, but as was seen in 2008, this can change overnight.
The S&P 500 index, when it had low Yale Crash Confidence Index readings, had already lost half their values. Today’s stock markets are down just 10%. Therefore whether or not the Yale Crash Confidence Index can be believed is entirely suspect.I would definitely believe a bounce was in the wings if the S&P was down 25% or more at this point. But it isn’t, so how the market direction can change and rally from here without some good news out of Europe, is hard to grasp.
Just because so many investors are totally bearish at just a 10% correction does not mean we cannot fall lower. Another 2% lower from here may see renewed selling such as we saw on Friday and Friday’s loss was just under 2.5%.
Recall the 2008 market crash and 2000 to 2003 bear markets in which some days saw more than 5% declines and we could have a lot more ahead of us at these somewhat lofty levels.
Stocks Are Starting To Look More Attractive But…
Stocks though are starting to look a lot more attractive but they have more room to fall. McDonalds Stock (MCD) is down below $87, but still 8% above its 52 week low of $80.00. Nucor Stock (NUE) at $35.77 actually closed up one cent on Friday but still is 16.6% above its 52 week low of $29.82. Priceline stock (PCLN) at $610.50 is still 32% above its 52 week low. Apple Stock (AAPL) is at $560.99 but again 69% above its 52 week low of $310.50. Amazon Stock (AMZN) is at $208.22 which is still 19% above its 52 week low.
The list goes on. The worst hit areas remain the financials and commodity related stocks. So while it might feel like a bear market it is still nowhere near as bad. A bear market will trash almost every stock making valuations shockingly cheap. For that to happen to stocks, there has to be a lot more damage to the stock markets and I believe we will need further catalysts to start wider selling of all risky assets. Greece leaving the Euro could be one such catalyst. Germany leaving the Euro would be an overnight panic on the markets.
Market Direction Feels Like A Bear
About the best thing I can say about market direction and stocks right now is they certainly feel bearish and sometimes that in itself is all that is needed to stop the selling. The problem with the present market is investors are correct in their assumptions that there is nothing wrong with holding onto their stocks, but uncertainty in Europe is all that it will take to make nervous investors think about dumping stocks and going to cash. The bear market of 2008 to 2009 is very fresh on investors minds.
In that kind of environment, once sellers enter the arena en mass, market direction may plummet until stocks find a bottom.