
The Market direction outlook for Thursday was for the market to move lower. From the outset the mood was bearish as Walmart’s earnings and Cisco’s did not meet expectations. As well the forward guidance was poor as was the outlook from Walmart on consumer spending. You would have thought this might buoy investors into thinking that a “weaker” economy means a longer period of Quantitative Easing from the Fed. However the Weekly Initial Unemployment Insurance Claims came in lower than expected by more than 10,000 which was seen by a lot of investors as more news for the Fed to use to consider withdrawing from Quantitative Easing starting in early fall.
Bond Yields Rising
Bond yields have continued to rise and today the 10 year Treasury broke over 2.8% as the belief that higher interest rates are around the corner continues to push up bond yields.
Gold and Market Direction
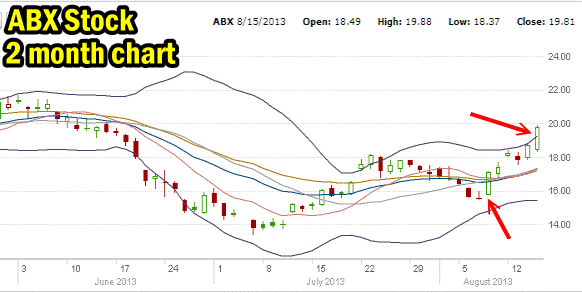
The big winner today was Gold which bounced back pushing up the gold sector stocks. ABX is now pushing toward $20.00. Just 6 days ago I had sold the Sept $14 put strike as the roller coaster ride in gold stocks continues. The belief among many gold enthusiasts is that inflation will shortly appear and gold will regain its shine. I have not idea whether this will be the case however I do love trading ABX Stock. You can view the ABX Stock trades for 2013 through this link. I have continued to trade naked calls and naked puts on ABX Stock as the stock moves up and down fluctuating with the price of gold, investor mood and various financial information out of Barrick Gold Corp. The ABX trades have become highly profitable returning $7340.00 against capital at risk of $28030.00 for a return of 26% so far this year.
Market Direction Action For Aug 15 2013
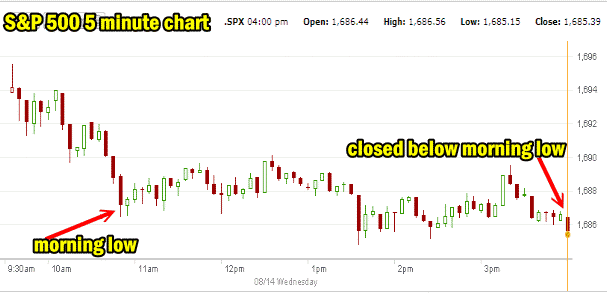
Yesterday’s 5 minute chart showed us the area of concern where the morning low was broken at the close. This is the signal that advised the market direction would probably move lower today. The chart from August 14 is below.
August 15th Chart
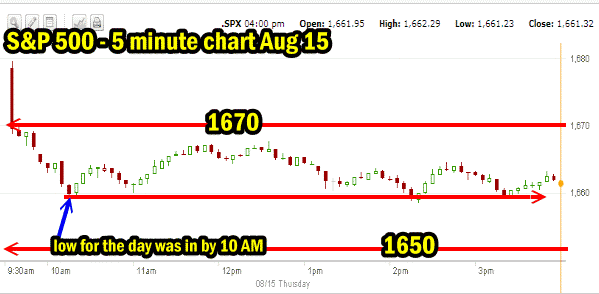
The chart for today (Aug 15) is below and you can see that the low for the day was in by 10:00 AM. I have written continually about the importance of the 1670 level for the S&P 500. This marks major support for the market direction up. Per all my market direction outlook articles, I bought Spy Put Options at the open as the market broke. I explained many times that I would be buying Spy Put Options when the market broke the 1670 level.
Next up is the 1650 level which I believe will break next and then the market direction may try to rally into September. That’s just a guess and not based on technical factors. I’ll look at those in a moment.
Market Direction Closing For Aug 15 2013
The S&P 500 closed at 1,661.32 down 24.07 and breaking the important 1670 support level. The Dow closed at 15,112.19 down 225.47 and doing technical damage to the uptrend. The NASDAQ closed at 3,606.12 down 63.16.
Market Direction Technical Indicators At The Close of Aug 15 2013
Let’s review the market direction technical indicators at the close of Aug 15 2013 on the S&P 500 and view the market direction outlook for Aug 16 2013.
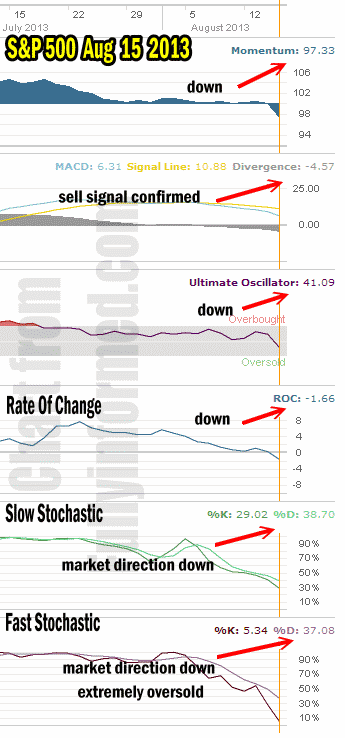
For Momentum I am using the 10 period. Momentum finally broke the neutral stance and has turned decidedly negative.
For MACD Histogram I am using the Fast Points set at 13, Slow Points at 26 and Smoothing at 9. MACD (Moving Averages Convergence / Divergence) issued a weak sell signal on July 31 which was confirmed August 7. Once again MACD has proven its merit as it was correct on July 31 when it indicated that the market direction trend was changing from up to down. Today that signal continues to climb further into sell territory.
The Ultimate Oscillator settings are Period 1 is 5, Period 2 is 10, Period 3 is 15, Factor 1 is 4, Factor 2 is 2 and Factor 3 is 1. These are not the default settings but are the settings I use with the S&P 500 chart set for 1 to 3 months.
The Ultimate Oscillator is now decidedly negative.
Rate Of Change is set for a 21 period. The rate of change is now also negative and falling.
For the Slow Stochastic I use the K period of 14 and D period of 3. The Slow Stochastic is signaling that the market direction is lower.
For the Fast Stochastic I use the K period of 20 and D period of 5. These are not default settings but settings I set for the 1 to 3 month S&P 500 chart when it is set for daily. The Fast Stochastic is indicating that the market direction is down again for Friday but it is extremely oversold so there is some chance of a bounce perhaps to start off the day before more selling enters.
Market Direction Outlook And Strategy for Aug 16 2013
The market direction trend is lower. The market direction timing indicators are all pointing to lower valuations ahead. We could see the Fed step in and make some further announcements to try to keep the market calm but at present the mood is bearish and the trend has slipped to down.
As I indicated in all my recent articles, I remained unconcerned about the market direction until the 1670 level was breached which happened Thursday morning. I then bought my Spy Put Options and I also bought Short ETFs for the market direction portfolio. I sold my Spy Put Options at the close of the day but I will be looking to pick up more on Friday. I prefer daily trades with the Spy Put Options rather than holding them longer term.
This is a break from the uptrend but not a break from the ongoing bull market. I am continuing to look for Put Selling opportunities and I am sure more will open up now that the market direction is moving lower.
For Friday we could see a bounce back near the open but a lot of technical damage was done to the markets on Thursday and that will take a few days to work out. Next stop I believe will be the 1650 on the S&P 500 and then I will reassess at that point.
Market Direction Internal Links
Profiting From Understanding Market Direction (Articles Index)
Understanding Short-Term Signals
Market Direction Portfolio Trades (Members)
Market Direction External Links
Market Direction IWM ETF Russell 2000 Fund Info
Market Direction SPY ETF 500 Fund Info