

FullyInformed.com
Generic filters

Stock Market Outlook For Mon Oct 26 2026 – For Start Of Final Week Of October Oversold Bounce Possible

Oct 26, 2026 | Stock Market Outlook

Stock Market Outlook - Bounce


Prior Trading Day Summary

On Friday Oct 26 stocks fell as oil prices climbed higher with Brent up above $116 a barrel which is the highest level in over four years. Middle East tensions are high and inflation rising. All of this combined to suppress stocks on Friday Oct 23.

The SPX fell 39 points to close at 7623. For the thid week of October the SPX lost 35 points in total. Volume was low at 5.1 billion shares traded with 60% of all volume being traded lower. 61% of all stocks we also falling. For the week though 48% of all stocks were still rising on average.

The NASDAQ fell 53 points closing at 25,955. Volume fell to 6.8 billion shares traded with 64% of all volume moving lower by the close. 59% of all stocks were also falling. But for the week the index lost just 184 points and 49% of stocks were rising on average for the week.

Overall the weekly numbers are not strongly bearish. Let’s review the closing technical indicators from Fri Oct 23 2026 to see what they predict for the start of the final week of October 2026.


Stock Market Outlook: SPX Closing Chart For Fri Oct 23 2026  

The index ended the day below the Upper Bollinger Band and the 21 and 50 day moving averages. It closed by the lower Bollinger Band. This is bearish.

The closing candlestick is bearish for Monday but with a top shadow which often signals a bounce is likely, at least at the start of the day.

The 21 day moving average is falling and closed at 7728. This is bearish.

The 50 day moving average is falling and closed at 7699. This is bearish.

The 100 day moving average is rising and closed at 7574. This is bullish.

The 200 day moving average is rising and closed at 7323. This is bullish.

The Lower Bollinger Band is below the 21 and 50 day moving average and falling. This is bullish for stocks. The Upper Bollinger Band is turning higher which is also bullish.

The SPX chart is more bearish than bullish for Monday but the Bollinger Bands are signaling a good chance for a bounce to start the final week of October.
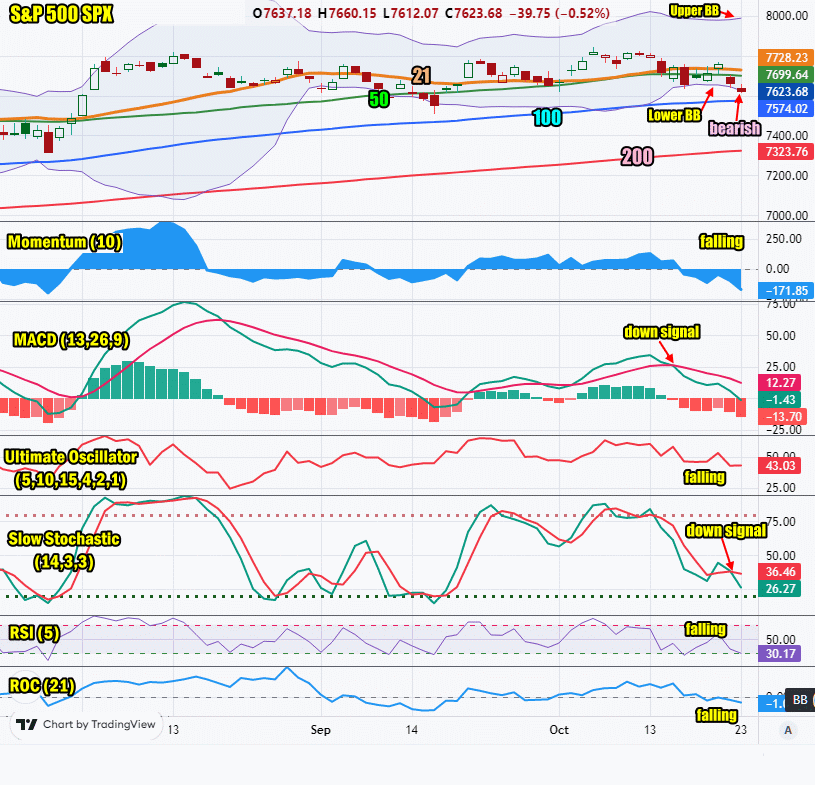
SPX Stock Market Outlook review of Fri Oct 23 2026


Stock Market Outlook: Technical Indicators Review

Momentum: Momentum is falling and negative. This is bearish.

  • Settings: For momentum I use a 10 period when studying market direction.
MACD Histogram: MACD (Moving Averages Convergence / Divergence) issued a down signal on Thu Oct 15 2026. The down signal was stronger on Fri Oct 23 2026. It is signaling a chance for a bounce.

  • Settings: For MACD Histogram, I am using the Fast Points set at 13, Slow Points at 26 and Smoothing at 9.
Ultimate Oscillator: The Ultimate Oscillator is falling which is bearish.

  • Settings: The Ultimate Oscillator settings are: Period 1 is 5, Period 2 is 10, Period 3 is 15, Factor 1 is 4, Factor 2 is 2 and Factor 3 is 1. These are not the default settings but are the settings I use with the S&P 500 chart set for 1 to 3 months.
Slow Stochastic: The Slow Stochastic has a down signal in place and is signaling lower.

  • Settings: For the Slow Stochastic I use the K period of 14 and D period of 3. The Slow Stochastic tries to predict the market direction further out than just one day.
Relative Strength Index: The RSI signal is falling which is bearish.

  • Settings: The relative strength index is set for a period of 5 which gives it 5 days of market movement to monitor. It is often the first indicator to show an overbought or oversold signal.
Rate of Change: The rate of change is falling signaling that Monday will end lower.

Settings: Rate Of Change is set for a 21 period. This indicator looks back 21 days and compares price action from the past to the present. With the Rate Of Change, prices are rising when signals are positive. Conversely, prices are falling when signals are negative. As an advance rises, the Rate Of Change signal should also rise higher, otherwise the rally is suspect. A decline should see the Rate Of Change fall into negative signals. The more negative the signals the stronger the decline.


Stock Market Outlook: Support and Resistance Levels

7850 is resistance
7825 is resistance
7800 is resistance
7780 is resistance
7750 is resistance
7700 is resistance
7650 is resistance
7600 is support
7570 is support
7550 is support
7500 is support


Stock Market Outlook for Mon Oct 26 2026 

For Monday Oct 26 the technical indicators are signaling stocks in general are oversold. They are also signaling that dips could be lower than anticipated for the day. Despite this down outlook, there is broad support for a market move higher, or a bounce to start the final week of October.

On Monday there are no economic or political reports to be released which means stocks have a chance for a rally today.


Potential Economic and Political Market Moving Events

Monday:

No events


Recent Outlooks

Morning Investing Strategy Notes for Fri Oct 23 2026

For FullyInformed Members the morning Investing Strategy Notes for Fri Oct 23 2026 discusses Thursday’s sell-off and the outlook for today and the start of next week. Equities discussed today include SpaceX Stock (SPCX), Tesla Stock (TSLA), Western Digital Stock …

Stock Market Outlook For Fri Oct 23 2026 – Choppy and Lower To End The Week

Prior Trading Day Summary On Thu Oct 22 2026 stocks tumbled with the prime focus on tech names once again. Investors worried about the AI spending amounts particularly after META earnings showed its first negative free cash flow in more …

Morning Investing Strategy Notes for Thu Oct 22 2026

For FullyInformed Members the morning Investing Strategy Notes for Thu Oct 22 2026 analyses whether the rally can continue today. Equities discussed today include SpaceX Stock (SPCX), Meta Stock (META), Tesla Stock (TSLA), Western Digital Stock (WDC), American Express Company …

Stock Market Outlook For Thu Oct 22 2026 – Dips Likely With Rally Into 4th Day

Prior Trading Day Summary Wednesday saw stocks rally stronger and more broad-based but there were some concerns. The SPX rose 44 points to close at 7757. Volume was 5 billion, 100 million less than yesterday. By the close 46% of …

Morning Investing Strategy Notes for Wed Oct 21 2026

For FullyInformed Members the morning Investing Strategy Notes for Wed Oct 21 2026 review the chance the rally can continue for a third day. Equities discussed today include Amazon.com Stock (AMZN), Netflix Stock (NFLX), SpaceX Stock (SPCX), United Airlines Stock …

Stock Market Outlook For Wed Oct 21 2026 – Still Bearish But SpaceX May Help

Prior Trading Day Summary Tue Oct 20 2026 stocks struggled to continue the rally. By the close the SPX was up 22 points to 7712 and for the week it was up 53 points. This is a recovery of 34% …

Morning Investing Strategy Notes for Tue Oct 20 2026

For FullyInformed Members the morning Investing Strategy Notes for Tue Oct 20 2026 review the outlook after Monday’s anemic bounce attempt. Equities discussed today include Wells Fargo Stock (WFC), Citigroup Stock (C), Amazon.com Stock (AMZN), Netflix Stock (NFLX), SpaceX Stock …

Stock Market Outlook For Tue Oct 20 2026 – Nice Bounce On Monday But Still Bearish

Prior Trading Day Summary On Monday stocks attempted a bounce. Neither the SPX or the NASDAQ were convincingly higher and the stats were not overly bullish. The SPX closed up 31 points on low volume of 4.6 billion shares traded …

Morning Investing Strategy Notes for Mon Oct 19 2026

For FullyInformed Members the morning Investing Strategy Notes for Mon Oct 19 2026 review the outlook for stocks as they face a new confirmed down signal. Equities discussed today include Taiwan Semiconductor Stock (TSM), 3M Company Stock (MMM), TQQQ ETF, …

Stock Market Outlook For Mon Oct 19 2026 – MACD Down Signal Confirmed But Bounce Likely To Start The Week

Prior Trading Day Summary Today is the anniversary of the Market Crash Of Oct 19 1987. I was quite a bit younger back then but recall the collapse which stunned investors and the Fed. They reacted quickly and restored confidence …

Morning Investing Strategy Notes for Fri Oct 16 2026

For FullyInformed Members the morning Investing Strategy Notes for Fri Oct 16 2026 review the outlook for Friday after two choppy days of trading.. Equities discussed today include IWM ETF, Taiwan Semiconductor Stock (TSM), Apple Stock (AAPL) and more. The …

Stock Market Outlook For Fri Oct 16 2026 – Dips Still Likely – New MACD Unconfirmed Down Signal

Prior Trading Day Summary On Thu Oct 15 2026 the market became more split with many tech names and in particular semiconductor stocks, falling lower adding to Wednesday’s losses in that sector. Bank stocks as well were largely negative. Many …

Morning Investing Strategy Notes for Thu Oct 15 2026

For FullyInformed Members the morning Investing Strategy Notes for Thu Oct 15 2026 review the outlook and the chance Wednesday’s sell-off will continue today. Equities discussed today include NVIDIA Stock (NVDA), Taiwan Semiconductor Stock (TSM), Apple Stock (AAPL) and more …

Stock Market Outlook For Thu Oct 15 2026 -Bounce Possible But Lower and Bearish

Prior Trading Day Summary On Wed Oct 14 2026 bank earnings from Morgan Stanley Stock (MS) and Bank Of America Stock (BAC) failed to excite any investors and both stocks plunged after earnings were released before the open. The real …

Subscribe For The Latest News