
Two days into the week and the market direction remains unchanged with the overall consensus among market timing indicators for the market to move higher over the next couple of sessions.
The Analysis of the Stock Market is pretty simple today. The testimony of Ben Bernanke upset investors as he did not mention anything about powering up the printing presses. Investors pushed the DOW down 80 points before it came back and closed up for the day. On one hand investors are complaining about the massive US debt and how it will eventually sink the stock market and economy while on the other hand they want the Fed to print more money to inflate stocks higher and push the US Dollar lower.
US Dollar Remains Tied To Market Direction
The US Dollar remains tied to the stock market direction and until the US Dollar declines I believe the stock market will remain range bound. Right now it would appear that the upper levels of that range may be about to be challenged. With Europe in a mess the US Dollar continues to be the currency of choice. Watching the US Dollar direction will assist investors in upcoming weeks. If the US Dollar pulls back the market can move higher. This will probably require the European debt crisis to move to the back burner for a while. Whether this can happen is anyone’s guess as Germany continues to fight any hope of a Euro Bond issue.
Market Timing Indicators for Tuesday June 17 2012
The Market Timing Indicators at the close of the stock market today are actually an interesting mix but the overall outlook is for market direction to move higher. On today’s chart I have started to show the dates. I did not realize that some readers did not understand that the chart I was showing was for a number of days. I apologize for this and hope my inclusion of the dates will assist with market direction analysis for readers.
Market Timing Analysis:
Yesterday’s market direction move lower albeit not by much was actually enough to push the Momentum Technical Indicator into a negative outlook. This is interesting as the Momentum indicator has not been negative since June 26 despite all the selling leading up to last Friday’s massive rally. Yet Monday’s small amount of selling had enough momentum that it pushed the indicator negative. Today, Momentum is still negative but has recovered slightly from yesterday.
The MACD Histogram or moving Average Convergence / Divergence is back climbing and has moved higher each day for the past 3 days. The MACD Histogram is positive and continues to point to a higher market direction.
The Ultimate Oscillator has also been climbing and today’s action which saw the S&P recover from a good sell off while Bernanke was speaking has pushed the Ultimate Oscillator into overbought. That does not mean the market direction will turn lower, but it is a signal for investors that an overbought condition is expanding in the market.
Rate of Change turned negative on Friday despite the big rally and is still negative today.
The Slow Stochastic has turned positive and Fast Stochastic is also positive, but with a reading of %K 83.00 it is advising that S&P 500 is becoming overbought. This reading is not unusual for either stochastic market timing indicators. They will often move as high as %K 99 in a rally.
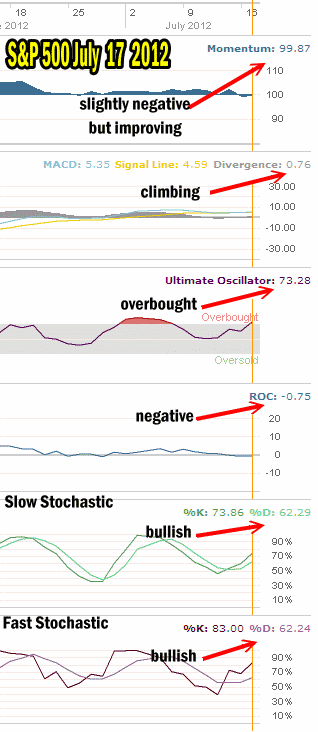
Market Timing Indicators for July 17 2012 show a consensus of market direction moving higher.
Market Timing Conclusion
The overall consensus then is 4 market timing indicators are bullish on the market direction and 2 are negative. The two that are negative are on the fringe of turning positive. I put more faith in the MACD Histogram for forecasting market direction. It is back climbing again and throughout the past couple of rallies, it was the MACD Histogram which correctly predicted market direction.
Market Direction And What Can Be Expected
Based on the chart below, the string of higher lows and higher highs is in place. I would expect any move higher should be able to push the market direction to at least 1380 or maybe even to 1400 if the pattern below is going to be repeated.
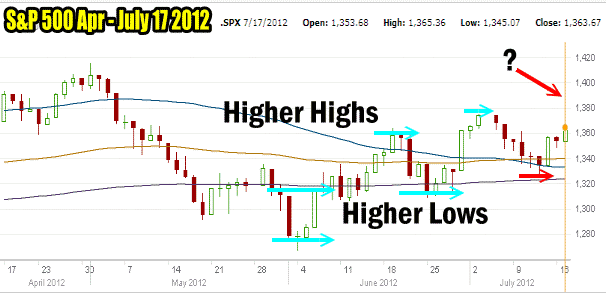
Market Direction shows the pattern of higher highs and higher lows that has developed. With market timing indicators remaining positive the market direction may be on the verge of pushing for close to 1400.
Candlestick Chart Analysis
For those readers who follow candlestick chart analysis, today’s closing candlestick was a black spinning top. Within Candlestick chart analysis, a black spinning top marks indecision between the bulls and bears. Indecision in most instances is almost a 50% split which way the market direction could turn. However with the market timing indicators 4 to 2 in favor of the market direction moving higher, I believe the black spinning top will end up with the market still moving up.
Market Direction Outlook And Put Selling
My favorite strategy is of course put selling. The market direction moving higher and confirmed by the consensus of the market timing indicators, advises me that any weakness in my favorite stocks is well worth considering for put selling as the overall trend for the next few days should be higher. Most stocks follow the market trend, so weakness in stocks is a good chance to sell some puts. But it is worthwhile to keep staying with the cautious bull strategy and hold back some extra cash for further opportunities up ahead.
July Options Expiry
While Friday options expiration may see the market pull back which according to the Trader’s Almanac has been the case 7 times in the last 11 years, I believe the market direction remains higher until the S&P 500 reaches 1380 to possibly 1400. At that point the market direction may stall out. But that’s just a prediction on my part looking into a somewhat foggy crystal ball. The market timing indicators are not picking a level, but are simple indicating that market direction is higher.