

Prior Trading Day Summary
On Wed Jul 8 2026 investors were once again focused on rising oil prices, inflation worries and the Iran conflict. The latest FOMC minutes were also a concern as they seemed to point to a strong possibility of one or more interest rate hikes by year-end. All of this weighed heavily and investors sold markets lower. Buyers though did return and the day ended with modest losses.
The SPX closed down a modest 21 points to 7482 well off the day’s lows. Volume was 5.2 billion shares traded with 69% of all stocks falling by the close.
The NASDAQ fell intraday but rallied back and closed up 52 points to 25,870. Volume was lower at 8.1 billion shares with 61% of stocks moving lower into the close.
Let’s review the closing technical indicators from Wed Jul 8 2026 to see what they predict for Thu Jul 9 2026.
Thank You For Taking Advantage Of This Year’s 4th of July Membership Specials
A special thank you to all members who took advantage of the 4th of July Membership Specials this year. Your support of FullyInformed.com is greatly appreciated. Don’t forget if you have questions make use of ASK TEDDI.
Stock Market Outlook: SPX Closing Chart For Wed Jul 8 2026
The index ended the day still above 21 day moving average. Intraday the index fell to the 21 day before bouncing back. This is bullish.
The closing candlestick is bearish for Thursday with a long shadow signaling probable weakness today.
The 21 day moving average is rising and closed at 7438. This is bullish.
The 50 day moving average is rising and closed at 7417. This is bullish.
The 100 day moving average is rising and closed at 7197. This is bullish.
The 200 day moving average is rising and closed at 6952. This is bullish.
The Lower Bollinger Band is rising. The Upper Bollinger Band is moving sideways as the SPX is into a Bollinger Bands Squeeze. The outlook is now for stocks to move higher and end the Bollinger Bands Squeeze.
The SPX chart is more bullish than bearish for Thu Jul 9 2026 but there are signs the index will see dips today.
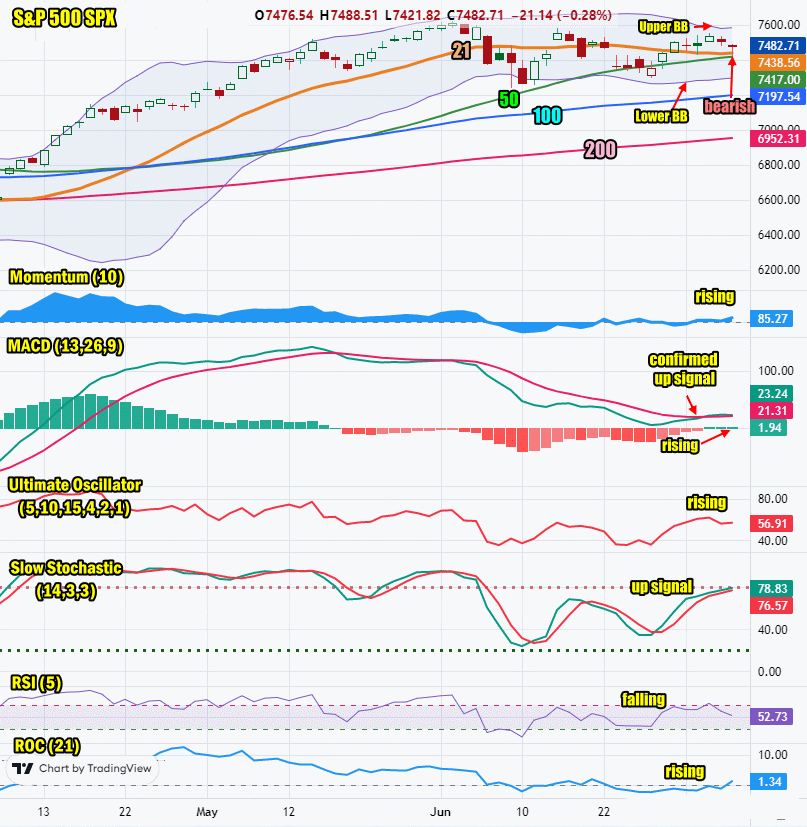
SPX Stock Market Outlook review of Wed Jul 8 2026
Stock Market Outlook: Technical Indicators Review
Momentum: Momentum is rising and positive. This is bullish.
|
MACD Histogram: MACD (Moving Averages Convergence / Divergence) issued an up signal on Mon Jul 6 2026. The up signal was unchanged on Wednesday which is a bit bearish.
|
Ultimate Oscillator: The Ultimate Oscillator is rising which is bullish.
|
Slow Stochastic: The Slow Stochastic has an up signal in place. It is bullish.
|
Relative Strength Index: The RSI signal is falling which is bearish.
|
| Rate of Change: The rate of change is rising signaling Thursday will end higher. Settings: Rate Of Change is set for a 21 period. This indicator looks back 21 days and compares price action from the past to the present. With the Rate Of Change, prices are rising when signals are positive. Conversely, prices are falling when signals are negative. As an advance rises, the Rate Of Change signal should also rise higher, otherwise the rally is suspect. A decline should see the Rate Of Change fall into negative signals. The more negative the signals the stronger the decline. |
Stock Market Outlook: Support and Resistance Levels |
| 7600 is resistance |
| 7590 is resistance |
| 7570 is resistance |
| 7550 is resistance |
| 7500 is resistance |
| 7450 is resistance |
| 7425 is resistance |
| 7400 is resistance |
| 7370 is resistance |
| 7350 is support |
| 7300 is support |
| 7280 is support |
| 7250 is support |
| 7200 is support |
| 7175 is support |
| 7150 is support |
| 7125 is support |
| 7100 is good support |
| 7050 is good support |
| 7000 is stronger support |
Stock Market Outlook for Thu Jul 9 2026
The SPX bounced off the 21 day moving average on Wednesday which is a signal that the index may move still lower before regaining its footing. The outlook remains bullish but the up signals, such as the MACD signal, are weak. With earnings from PepsiCo Stock (PEP) to be released today before the open, we may see stocks fall if PepsiCo Stock (PEP) does not easily beat the consensus.
Watch for weakness in stocks today. Weakness is still an opportunity to setup more trades but I am keeping my positions smaller in every trade just in case the SPX continues to move lower for the next several days.
Potential Economic and Political Market Moving Events
Monday:
9:45 PMI Services was higher than estimated, coming in at 51.2
10:45 ISM Business Services PMI for June was slightly less than estimated coming in at 54
11:00 Global services PMI for June was higher than estimated, coming in at 51.7
Tuesday:
No reports are expected
Wednesday:
2:00 FOMC meeting minutes
Thursday:
8:30 Weekly Initial Unemployment Insurance Claims are expected to rise to 218,000
10:00 Existing home sales for Jun are estimated unchanged at 4.2 million
Friday:
No reports are expected