
Prior Trading Day Summary
On Thu Jul 9 2026 stocks ended the day higher but on declining trade volumes.
The SPX closed up 61 points to 7543 . Trading volume was a low 4.6 billion but 61% of stocks on the index closed higher which is bullish.
The NASDAQ rose 336 points to end the day at 26,206. Volume was terrible at 7.5 billion shares traded by the close saw 63% of all stocks rising.
Despite the low volume day, Thursday was fairly positive for stocks. On Friday before the open we get earnings from Delta Air Lines (DAL) which could help set the mood for the day, if earnings beat all estimates.
Let’s review the closing technical indicators from Thu Jul 9 2026 to see what they predict for Fri Jul 10 2026.
Stock Market Outlook: SPX Closing Chart For Thu Jul 9 2026
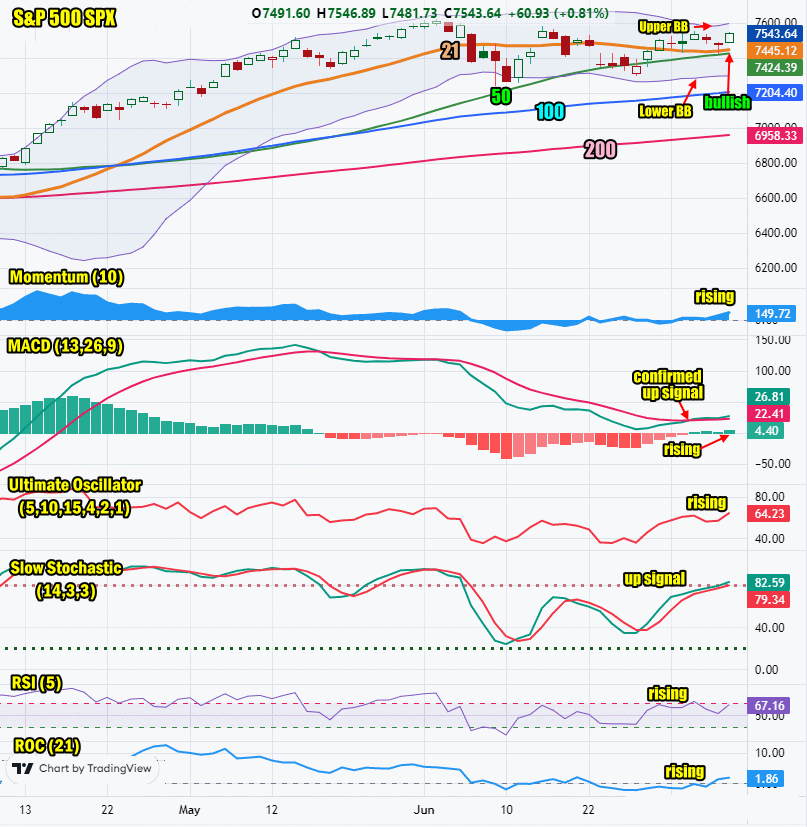
The index ended the day further above 21 day moving average. Looking at the SPX chart below you can see that the index is actually trending sideways rather than up or down. With the next round of earnings starting today and bank earnings next week, we could see the index finally break to new highs.
The closing candlestick is bullish for Friday.
The 21 day moving average is rising and closed at 7445. This is bullish.
The 50 day moving average is rising and closed at 7424. This is bullish.
The 100 day moving average is rising and closed at 7204. This is bullish.
The 200 day moving average is rising and closed at 6958. This is bullish.
The Lower Bollinger Band is rising. The Upper Bollinger Band is back rising. We may see the Bollinger Bands Squeeze end early next week. The outlook is still for stocks to move higher out of the Bollinger Bands Squeeze.
The SPX chart is more bullish than bearish for Fri Jul 10 2026.
SPX Stock Market Outlook review of Thu Jul 9 2026
Stock Market Outlook: Technical Indicators Review
Momentum: Momentum is rising and positive. This is bullish.
|
MACD Histogram: MACD (Moving Averages Convergence / Divergence) issued an up signal on Mon Jul 6 2026. The up signal was stronger on Thursday. This is bullish.
|
Ultimate Oscillator: The Ultimate Oscillator is rising which is bullish.
|
Slow Stochastic: The Slow Stochastic has an up signal in place. It is bullish.
|
Relative Strength Index: The RSI signal is rising which is bullish.
|
| Rate of Change: The rate of change is rising signaling Friday will end higher. Settings: Rate Of Change is set for a 21 period. This indicator looks back 21 days and compares price action from the past to the present. With the Rate Of Change, prices are rising when signals are positive. Conversely, prices are falling when signals are negative. As an advance rises, the Rate Of Change signal should also rise higher, otherwise the rally is suspect. A decline should see the Rate Of Change fall into negative signals. The more negative the signals the stronger the decline. |
Stock Market Outlook: Support and Resistance Levels |
| 7600 is resistance |
| 7590 is resistance |
| 7570 is resistance |
| 7550 is resistance |
| 7500 is resistance |
| 7450 is resistance |
| 7425 is resistance |
| 7400 is resistance |
| 7370 is resistance |
| 7350 is support |
| 7300 is support |
| 7280 is support |
| 7250 is support |
| 7200 is support |
| 7175 is support |
| 7150 is support |
| 7125 is support |
| 7100 is good support |
| 7050 is good support |
| 7000 is stronger support |
Stock Market Outlook for Fri Jul 10 2026
The SPX looks steady for Friday. There could be a bit of weakness in the morning but if Delta Air Lines (DAL) earnings are not “terrible”, the day will end higher. Next week the next quarterly earnings will take affect as banks report during the week. It could be a choppy week although I expect banks will beat estimates and move higher.
Potential Economic and Political Market Moving Events
Monday:
9:45 PMI Services was higher than estimated, coming in at 51.2
10:45 ISM Business Services PMI for June was slightly less than estimated coming in at 54
11:00 Global services PMI for June was higher than estimated, coming in at 51.7
Tuesday:
No reports are expected
Wednesday:
2:00 FOMC meeting minutes
Thursday:
8:30 Weekly Initial Unemployment Insurance Claims came in at 215,000 just shy of estimates of 218,000
10:00 Existing home sales for Jun were lower than estimated, coming in at 4.1 million versus 4.2 million prior
Friday:
No reports are expected