
The Ultimate Oscillator as regular readers know is among my favored market direction technical timing indicators. As well I enjoy using the ultimate oscillator on many stock positions and it is a main ingredient in many of the strategies I use for profiting from stock and market direction trades, put selling and movements in underlying assets. In short I have a lot of faith in the Ultimate Oscillator.
Ultimate Oscillator and Market Direction
My ultimate oscillator readings for the past few days on the S&P 500 as the market direction continued to climb higher showed an increasingly overbought market. You can see in the 1 month chart below the overbought indications from the Ultimate Oscillator as the market direction pushed up.
For the Ultimate Oscillator I use custom settings for market direction readings. You can see the settings below.
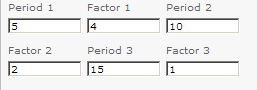
My customer Ultimate Oscillator Settings
Today the Ultimate Oscillator gave an overbought reading of $84.80. The last time this high of an overbought readings in the Ultimate Oscillator was seen was on July 24 2009 as the market was recovering from the March 2009 lows. At that stage the market was racing back as more and more investors piled in to buy stocks on the cheap.
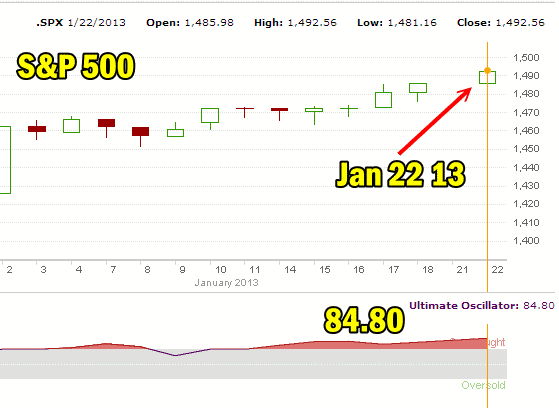
Jan 22 2013 reading of 84.80 on the S&P 500 has not occurred since July 24 2009
The question today should be, are stocks still cheap? They certainly are not as cheap as in July 2009 but at the same time, earnings were recovering at that point in 2009 so stocks to a lot of investors seemed over priced based on the low earnings of 2008 and 2009.
If stocks today can on average improve earnings further, then a case can possibly be made for stocks still being reasonably priced or at least that’s what a lot of investors seem to be believing.
Let’s review other Ultimate Oscillator periods when readings were as overbought as they are now to see if we can learn what to expect from the market direction as a direct result of the overbought condition of the Ultimate Oscillator.
Market Direction and Ultimate Oscillator in Dec 2010
On December 27 2010 the Ultimate Oscillator flashed 83.84 as again it was extremely overbought in a rally that lasted 7 days up in market direction which is rare for the stock market. The overbought signal disappeared within a few days as the market slowed and went sideways for two days before resuming the uptrend. Note there the market direction didn’t fall by much at all but instead went sideways before resuming the uptrend.
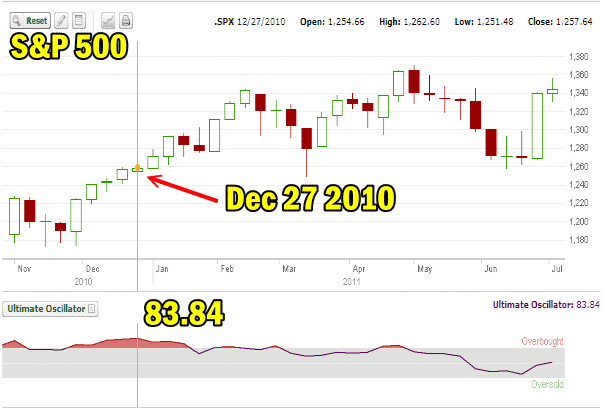
Market Direction moved higher and the extreme overbought reading eroded after two sideways days.
Market Direction and Ultimate Oscillator in July 2009
In July 2009 the buying frenzy after the March 2009 low saw the market direction tire after the high Ultimate Oscillator reading of 84.81 but after two sideways days which you can see in the chart, the market direction continued higher and the extreme overbought readings of the Ultimate Oscillator were gone.
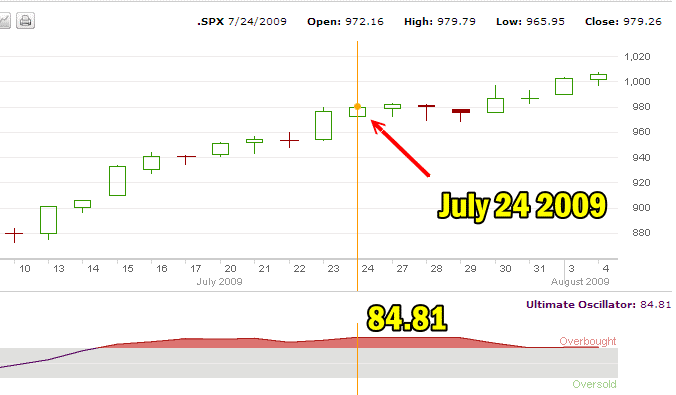
The overbought condition in the Market Direction in July 2009 eroded quickly with 2 sideways days and then the uptrend continued.
Market Direction and Ultimate Oscillator in October 2006
In October 2006 the extreme Ultimate Oscillator readings were followed by a market direction pull back and then market direction turned back up as it rose higher into 2007.
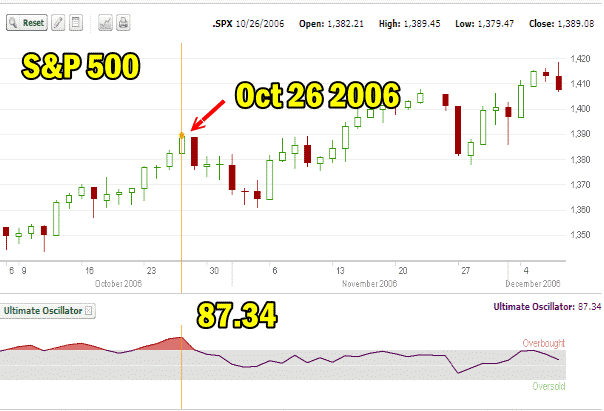
Once again the extreme overbought readings of the Ultimate Oscillator in October 2006 were followed by some down days as the market pulled back and then the push higher continued in the S&P 500.
Market Direction For Jan 23 2013 Based On Ultimate Oscillator Readings
The Ultimate Oscillator is now reading 84.80 and this is extreme. As you can see in 2006 a reading of 87.34 was experienced which resulted in the market pulling back for a few days before continuing the market direction push higher.
The above few charts are all the very extreme overbought readings in the Ultimate Oscillator since 2006. That is how few times the market direction has become as overbought as it is on Jan 22 2013. The above charts also show that the market direction does not stop climbing, but in every instance the market stalled and either turned sideways or pulled back before recommencing the market direction push higher.
I am confident the S&P 500 will try to break 1500 but I am not sure it will do it before the market direction stalls out for a rest. As you can see above the chance of the market direction up stopping for a couple of days is quite high.
Market Direction and Covered Calls Positions
For investors who sold covered calls in the uptrend and have become concerned as the covered calls have become in the money or close to the money, this could be a chance to buy them back and rescue stock that may be exercised away. I believe the market direction sideways will afford some investors the chance to consider buying back in the money covered calls, but that opportunity may be only two days at most.
Market Direction and Put Selling Positions
I also believe once the market direction stalls and moves sideways whether for one or two days, it could provide some good Put Selling opportunities before the market direction turns back to another relentless push to try to break the 2007 all time highs.
Market Direction and Ultimate Oscillator Summary
To sum up this market direction article, keep an eye out for a stalling of the push higher and watch for opportunities to adjust positions you have wanted to adjust but could not because of the constant move higher in the stock markets. This lull in the market direction push higher could be short-lived. I’ll be watching for it to occur and for it to end to adjust some of my own trades and make new ones.
I think the Ultimate Oscillator readings are sending a clear signal and reviewing past periods in the S&P 500 history when the Ultimate Oscillator was this overbought I believe the odds of a break in the market direction push higher are very good indeed.