

Prior Trading Day Summary
On Tue Aug 18 2026 with oil prices rising and bond yields rising to level not seen in two decades, stocks couldn’t hold their recent gains.
The SPX ended the day down 53 points to close at 7691. Intraday the SPX saw another low volume day of 4.6 billion shares traded with 63% of that volume being traded lower and 64% of all stocks falling by the close.
The NASDAQ fell 355 points ending the day at 26,289. Volume was low at 7.5 billion shares traded. By the close 61% of all volume was being traded lower and 57% of all stocks were falling.
Let’s review the technical indicators from the close of Tue Aug 18 2026 to see what they predict for Wed Aug 19 2026.
Stock Market Outlook: SPX Closing Chart For Tue Aug 18 2026
The index ended the day below the Upper Bollinger Band for a seventh day which is bearish.
The closing candlestick is bearish for Wednesday and signals dips are likely.
The 21 day moving average is rising and closed at 7604. This is bullish.
The 50 day moving average is rising and closed at 7521. This is bullish.
The 100 day moving average is rising and closed at 7373. This is bullish.
The 200 day moving average is rising and closed at 7114. This is bullish.
The Lower Bollinger Band is rising which is bearish. The Upper Bollinger Band is trending sideways which is bearish. Signals are advising stocks may pullback shortly.
The SPX chart is almost equally split between bear and bull. A lower day is being signaled.
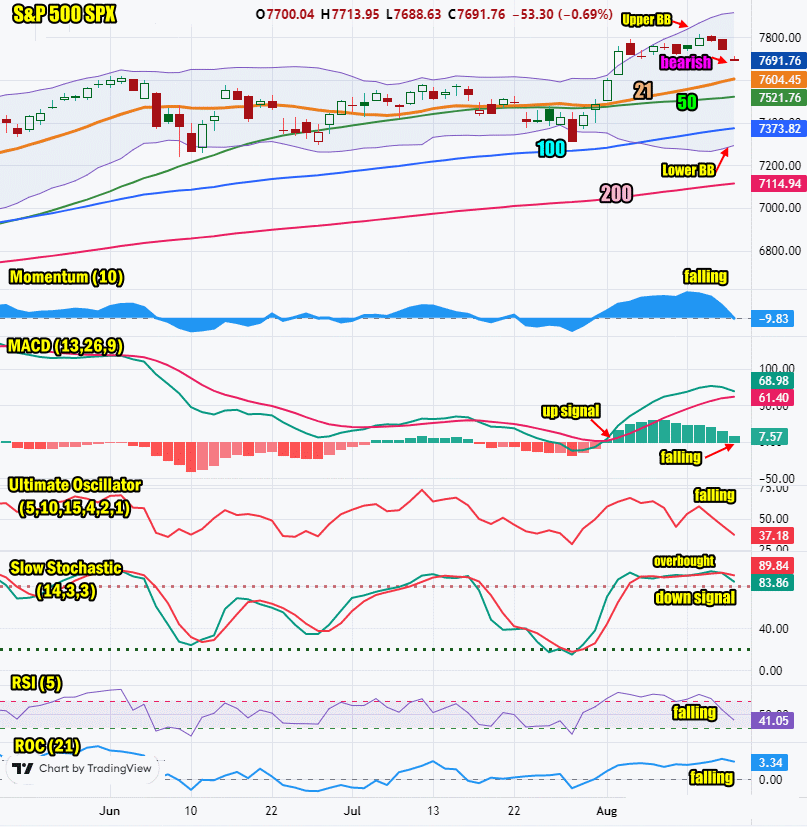
SPX Stock Market Outlook review of Tue Aug 18 2026
Stock Market Outlook: Technical Indicators Review
Momentum: Momentum is falling and negative. This is bearish.
|
MACD Histogram: MACD (Moving Averages Convergence / Divergence) issued an up signal on Mon Aug 3 2026. The up signal was weaker on Tue Aug 18 2026. A lower day on Wednesday will see a down signal generated from the MACD technical indicator.
|
Ultimate Oscillator: The Ultimate Oscillator is falling which is bearish.
|
Slow Stochastic: The Slow Stochastic has a down signal in place. It is overbought and bearish.
|
Relative Strength Index: The RSI signal is falling. This is bearish.
|
| Rate of Change: The rate of change is falling. It is signaling Wednesday will end lower. Settings: Rate Of Change is set for a 21 period. This indicator looks back 21 days and compares price action from the past to the present. With the Rate Of Change, prices are rising when signals are positive. Conversely, prices are falling when signals are negative. As an advance rises, the Rate Of Change signal should also rise higher, otherwise the rally is suspect. A decline should see the Rate Of Change fall into negative signals. The more negative the signals the stronger the decline. |
Stock Market Outlook: Support and Resistance Levels |
| 7800 is resistance |
| 7780 is resistance |
| 7750 is resistance |
| 7700 is resistance |
| 7650 is resistance |
| 7600 is resistance |
| 7590 is resistance |
| 7570 is resistance |
| 7550 is resistance |
| 7500 is support |
| 7450 is support |
| 7425 is support |
| 7400 is support |
Stock Market Outlook for Wed Aug 19 2026
For TWednesday the technical indicators are all pointing lower for the index. Normally when all the technical indicators are negative we can often expect a bounce before a move still lower. On Wednesday we also get the latest FOMC minutes which will be watched for signs of a September rate hike which I think is unlikely.
Expect more dips on Wednesday but a chance for a rally into the 2:00 PM release of Fed minutes and then a lower move again. We get retail numbers from a variety of companies including Target today. This may impact stocks as well especially if earnings beat all estimates.
For Wednesday I am expecting lower close. We could see a new down signal from the MACD technical indicator by the close today. That will be bearish for the week.
In the econo9mic reports, Tuesday’s reports were below estimates and all the reports point to a slowing economy. This should help the case against raising interest rates.
Potential Economic and Political Market Moving Events
Monday:
8:30 Empire State Manufacturing Survey beat estimated and rose to 20.6
10:00 NAHB Housing Market Index for August beat estimates and rose to 35
Tuesday:
8:30 Housing starts for July were lower than estimated, coming in at 1.2 million
8:30 Import prices were far lower than estimated, coming in at -0.4%
9:15 Industrial production month over month for Julywas weaker than estimated, coming in at 0.2%
10:00 Pending Home Sales month over month were lower than estimated at -2.3%
Wednesday:
2:00 FOMC latest minutes