
Prior Trading Day Summary
On Thu Aug 20 2026 stocks moved lower as bond yields rose again despite the efforts of Treasury Secretary Bessent to calm bond markets. days is anyone’s guess.
The SPX ended the day down 66 points to close at 7641. Volume was lower at 4.9 billion with 64% of all stocks falling on the index by the close.
The NASDAQ fell 264 points ending the day at 26,067. Volume was unchanged at 8.5 billion shares traded. By the close 60% of all stocks were falling.
Let’s review the technical indicators from the close of Thu Aug 20 2026 to see what they predict for Fri Aug 21 2026.
Stock Market Outlook: SPX Closing Chart For Thu Aug 20 2026
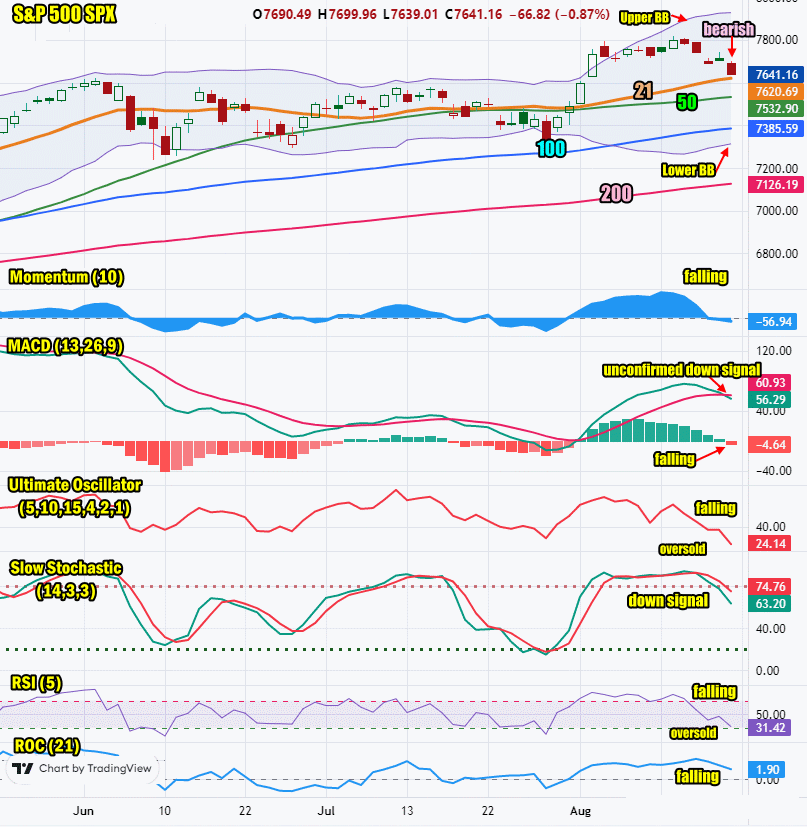
The index ended the day below the Upper Bollinger Band and just above the 21 day moving average. This is bearish.
The closing candlestick is bearish for Friday although it also points to a bounce attempt off the 21 day moving average for Friday.
The 21 day moving average is rising and closed at 7620. This is bullish.
The 50 day moving average is rising and closed at 7532. This is bullish.
The 100 day moving average is rising and closed at 7385. This is bullish.
The 200 day moving average is rising and closed at 7126. This is bullish.
The Lower Bollinger Band is rising which is bearish. The Upper Bollinger Band is trending sideways which is bearish. Signals are advising stocks may pullback further.
The SPX chart is more bearish than bullish for Friday but also signals a bounce off the 21 day is likely.
SPX Stock Market Outlook review of Thu Aug 20 2026
Stock Market Outlook: Technical Indicators Review
Momentum: Momentum is falling and negative. This is bearish.
|
MACD Histogram: MACD (Moving Averages Convergence / Divergence) issued an up signal on Mon Aug 3 2026. The up signal was gone on Thu Aug 20 2026 and replaced with an unconfirmed down signal. I expect the signal down will be confirmed on Friday.
|
Ultimate Oscillator: The Ultimate Oscillator is falling which is bearish. It is approaching oversold levels where a bounce could be expected.
|
Slow Stochastic: The Slow Stochastic has a down signal in place. It is bearish.
|
Relative Strength Index: The RSI signal is falling and into oversold levels. A bounce is likely.
|
| Rate of Change: The rate of change is falling. It is signaling Friday will end lower. Settings: Rate Of Change is set for a 21 period. This indicator looks back 21 days and compares price action from the past to the present. With the Rate Of Change, prices are rising when signals are positive. Conversely, prices are falling when signals are negative. As an advance rises, the Rate Of Change signal should also rise higher, otherwise the rally is suspect. A decline should see the Rate Of Change fall into negative signals. The more negative the signals the stronger the decline. |
Stock Market Outlook: Support and Resistance Levels |
| 7800 is resistance |
| 7780 is resistance |
| 7750 is resistance |
| 7700 is resistance |
| 7650 is resistance |
| 7600 is resistance |
| 7590 is resistance |
| 7570 is resistance |
| 7550 is resistance |
| 7500 is support |
| 7450 is support |
| 7425 is support |
| 7400 is support |
Stock Market Outlook for Fri Aug 21 2026
For Fri Aug 21 2026 the technical indicators are advising that further downside is likely but at the same time a bounce is more probable for today. Many stocks are moving into overbought status. Usually we can expect a bounce attempt off the 21 day moving average which should occur today.
The index may try for a bounce on Friday but the down signal from the MACD indicator is reasonably strong. That signals any bounce may not hold at present. The SPX has little support until the index gets down to around 7500. That would be the valuation to watch. If the SPX ends up at 7500 next week, watch for a large bounce attempt. If 7500 breaks however, the next level of any support is at 7450.
Potential Economic and Political Market Moving Events
Monday:
8:30 Empire State Manufacturing Survey beat estimated and rose to 20.6
10:00 NAHB Housing Market Index for August beat estimates and rose to 35
Tuesday:
8:30 Housing starts for July were lower than estimated, coming in at 1.2 million
8:30 Import prices were far lower than estimated, coming in at -0.4%
9:15 Industrial production month over month for Julywas weaker than estimated, coming in at 0.2%
10:00 Pending Home Sales month over month were lower than estimated at -2.3%
Wednesday:
2:00 FOMC latest minutes
Thursday:
8:30 Weekly Initial Unemployment Insurance Claims for Aug 15 were below estimates at 206,000
10:00 Leading indicators from July were higher than estimated at 0.2%
Friday:
9:45 Flash Manufacturing PMI for August is estimated at 54, up from 53.8 prior
9:45 Flash Services PMI for Aug is estimated at 53.9 up slightly from 53.6 prior