

FullyInformed.com
Generic filters

Stock Market Outlook For Tue Aug 18 2026 – Weakness With Dips

Aug 18, 2026 | Stock Market Outlook

Weakness Dips Likely


Prior Trading Day Summary

On Mon Aug 17 2026 stock indexes ended the day slightly lower as investors attention returned to the Iran conflict and rising bond yields.

The SPX ended the day down 40 points to close at 7745. Intraday the SPX saw very low volume of 4.5 billion shares traded with 69% of that volume being traded lower and 66% of all stocks falling by the close.

The NASDAQ fell 84 points ending the day at 26,644. Volume was low at 7.9 billion shares traded. By the close 51% of all volume was being traded lower and 60% of all stocks were falling.

Let’s review the technical indicators from the close of Mon Aug 17 2026 to see what they predict for Tue Aug 18 2026.


Stock Market Outlook: SPX Closing Chart For Mon Aug 17 2026 

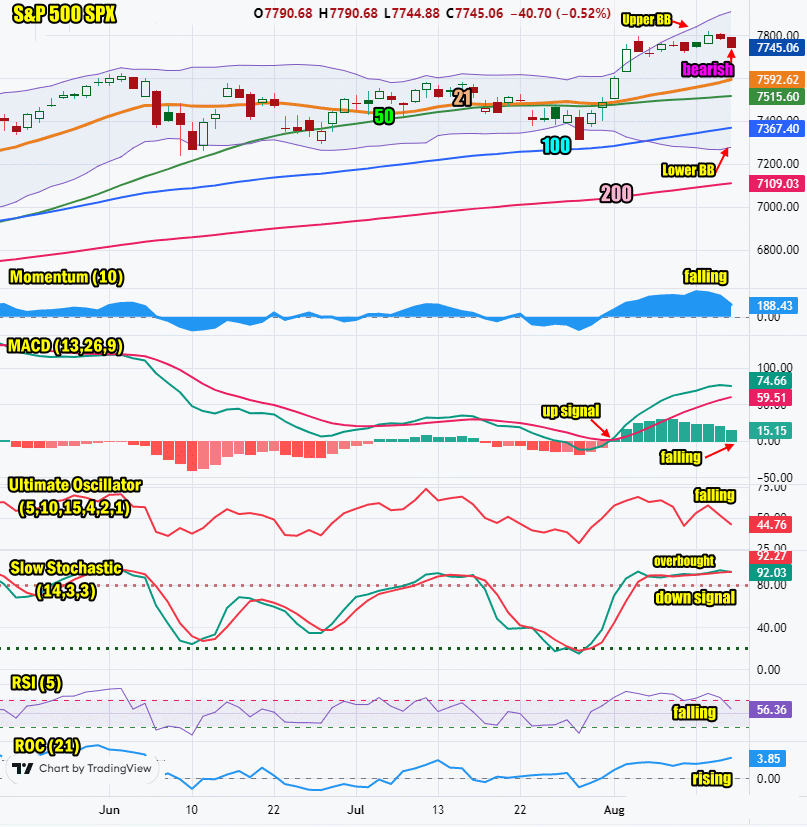
The index ended the day below the Upper Bollinger Band for a sixth day which is bearish.

The closing candlestick is bearish for Tuesday and signals dips are likely.

The 21 day moving average is rising and closed at 7592. This is bullish.

The 50 day moving average is rising and closed at 7515. This is bullish.

The 100 day moving average is rising and closed at 7367. This is bullish.

The 200 day moving average is rising and closed at 7109. This is bullish.

The Lower Bollinger Band is rising which is bearish. The Upper Bollinger Band is rising which is bullsh.

The SPX chart is still more bullish than bearish for Tuesday but there are bearish signs to be aware of.
SPX Stock Market Outlook review of Mon Aug 17 2026


Stock Market Outlook: Technical Indicators Review

Momentum: Momentum is falling and positive. It is bullish.

  • Settings: For momentum I use a 10 period when studying market direction.
MACD Histogram: MACD (Moving Averages Convergence / Divergence) issued an up signal on Mon Aug 3 2026. The up signal was weaker on Mon Aug 17 2026.

  • Settings: For MACD Histogram, I am using the Fast Points set at 13, Slow Points at 26 and Smoothing at 9.
Ultimate Oscillator: The Ultimate Oscillator is falling which is bearish.

  • Settings: The Ultimate Oscillator settings are: Period 1 is 5, Period 2 is 10, Period 3 is 15, Factor 1 is 4, Factor 2 is 2 and Factor 3 is 1. These are not the default settings but are the settings I use with the S&P 500 chart set for 1 to 3 months.
Slow Stochastic: The Slow Stochastic has a weak down signal in place. It is overbought.

  • Settings: For the Slow Stochastic I use the K period of 14 and D period of 3. The Slow Stochastic tries to predict the market direction further out than just one day.
Relative Strength Index: The RSI signal is falling. This is bearish.

  • Settings: The relative strength index is set for a period of 5 which gives it 5 days of market movement to monitor. It is often the first indicator to show an overbought or oversold signal.
Rate of Change: The rate of change is rising. It is signaling Tuesday will end higher.

Settings: Rate Of Change is set for a 21 period. This indicator looks back 21 days and compares price action from the past to the present. With the Rate Of Change, prices are rising when signals are positive. Conversely, prices are falling when signals are negative. As an advance rises, the Rate Of Change signal should also rise higher, otherwise the rally is suspect. A decline should see the Rate Of Change fall into negative signals. The more negative the signals the stronger the decline.


Stock Market Outlook: Support and Resistance Levels

7825 is resistance
7800 is resistance
7780 is resistance
7750 is resistance
7700 is resistance
7650 is resistance
7600 is resistance
7590 is resistance
7570 is resistance
7550 is resistance
7500 is resistance
7450 is support
7425 is support
7400 is support
7370 is support
7350 is support
7300 is support


Stock Market Outlook for Tue Aug 18 2026 

For Tue Aug 18 2026 the technical indicators are signaling the day will end lower for a third straight day.

Dips will occur on Tuesday and are still opportunities to setup trades but the Lower Bollinger Band turning higher could be an early warning that the index will pullback further before resuming the uptrend.


Potential Economic and Political Market Moving Events

Monday:

8:30 Empire State Manufacturing Survey beat estimated and rose to 20.6

10:00 NAHB Housing Market Index for August beat estimates and rose to 35

Tuesday:

8:30 Housing starts for July are estimated at 1.3 million, down from 1.4 million prior

8:30 Import prices are estimated to have fallen 0.1% from 0.3% prior

9:15 Industrial production month over month for July is estimated to rise 0.4% from 0.1% prior

10:00 Pending Home Sales month over month are estimated to rise to 0.6% from -5.4% prior


Recent Outlooks

Stock Market Outlook For Wed Aug 19 2026 – Weakness and Lower – FOMC Minutes

Prior Trading Day Summary On Tue Aug 18 2026 with oil prices rising and bond yields rising to level not seen in two decades, stocks couldn’t hold their recent gains. The SPX ended the day down 53 points to close …

Morning Investing Strategy Notes for Tue Aug 18 2026

For FullyInformed Members the morning Investing Strategy Notes for Tue Aug 18 2026 discuss the outlook for stocks following a second down day on Monday. There are a number of equity trades today. Stocks include Wells Fargo Stock (WFC), SMH …

Morning Investing Strategy Notes for Mon Aug 17 2026

For FullyInformed Members the morning Investing Strategy Notes for Mon Aug 17 2026 discuss the prior week and the outlook for the third week of August for equities. There are a number of equity trades today. Stocks include Home Depot …

Stock Market Outlook For Mon Aug 17 2026 – Dips Likely But Higher Close

Prior Trading Day Summary On Fri Aug 14 2026 the stocks saw further weakness with both the S&P and NASDAQ ending in the red. The SPX ended the day down 18 points to close at 7780. Intraday the SPX saw …

Morning Investing Strategy Notes for Fri Aug 14 2026

For FullyInformed Members the morning Investing Strategy Notes for Fri Aug 14 2026 review the rally on Thursday. There are a number of equity trades today. Stocks include Netflix Stock (NFLX), Western Digital Stock (WDC), International Business Machines Stock (IBM) …

Stock Market Outlook For Fri Aug 14 2026 – Bullish – New Highs

Prior Trading Day Summary On Thu Aug 13 2026 the July PPI numbers came in more “tame” than many analysts were predicting. Stocks moved higher as a result. The SPX ended the day up 50 points to close at 7798, …

Morning Investing Strategy Notes for Thu Aug 13 2026

For FullyInformed Members the morning Investing Strategy Notes for Thu Aug 13 2026 review the market action on Wednesday. There are a number of equity trades today. Stocks include ARM Stock (ARM), Cisco Stock (CSCO), Tapestry Inc Stock (TPR), Applied …

Stock Market Outlook For Thu Aug 13 2026 – Mixed Outlook For Second Day Ahead Of PPI Numbers

Prior Trading Day Summary On Wed Aug 12 2026 the July CPI numbers came in as estimated but did not show inflation is taking off. Stocks tried to rally off the news but with the latest PPI numbers due of …

Morning Investing Strategy Notes for Wed Aug 12 2026

For FullyInformed Members the morning Investing Strategy Notes for Wed Aug 12 2026 review the outlook for Wed Aug 12 2026 with the release of the July CPI numbers. There are a number of equity trades today. Stocks include Coreweave …

Stock Market Outlook For Wed Aug 12 2026 – Mixed Outlook Ahead Of Latest CPI Numbers

Prior Trading Day Summary On Tue Aug 11 2026 stocks continued to see light selling pressure as investors wait for more information on the Strait of Hormuz reopening and the latest CPI numbers today before the open. The SPX ended …

Morning Investing Strategy Notes for Tue Aug 11 2026

For FullyInformed Members the morning Investing Strategy Notes for Tue Aug 11 2026 review the outlook for Tue Aug 11 2026, one day ahead of the latest CPI numbers which are due out Wed Aug 12 2026 before the start …

Stock Market Outlook For Tue Aug 11 2026 – Still Bullish Ahead Of Wednesday’s CPI Numbers

Prior Trading Day Summary On Mon Aug 10 2026 stocks had a seesaw day as investors weighed the continued drama over the Strait of Hormuz and prepared for the CPI numbers due out Wednesday at 8:30. These will give the …

Morning Investing Strategy Notes for Mon Aug 10 2026

For FullyInformed Members the morning Investing Strategy Notes for Mon Aug 10 2026 review the outlook for the start of the second week of August. There are a number of equity trades today. Stocks include Goldman Sachs Stock (GS), Berkshire …

Stock Market Outlook For Mon Aug 10 2026 – Choppy Bias Higher

Prior Trading Day Summary On Fri Aug 6 2026 the initial reaction from investors on the surprising loss of jobs as reported by the July Non-Farm Payroll Numbers report was negative but by 10:15 stocks had already seen the day’s …

Subscribe For The Latest News